|
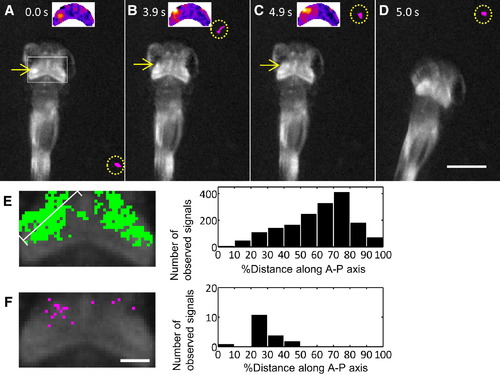
Tectal Responses of a 5 dpf Free-Swimming Larva during Perception of a Prey(A–D) Ca2+ signals in the tectum and prey capture behavior (Movie S5).(A–C) Ca2+ signals (arrows) were detected in the left tectum (arrows) when a paramecium moved from posterior to anterior on the right. Insets are pseudocolored ratio images.(C and D) The fish changed its direction and started approach swimming. The swimming paramecium is colored in magenta and encircled by dotted lines.(E) Left: positions of total Ca2+ signals observed on the tectal neuropil during the recording. Right: histogram of the Ca2+ signals’ relative distances along the anteroposterior axis of the tectum.(F) Left: positions of the Ca2+ signals observed in (C), one frame before the start of approach swimming. Right: histogram of the Ca2+ signals’ relative distances. Scale bar represents 100 μm.
|