
Fig. 2
- ID
- ZDB-FIG-130502-4
- Publication
- Muto et al., 2013 - Real-Time Visualization of Neuronal Activity during Perception
- Other Figures
- All Figure Page
- Back to All Figure Page
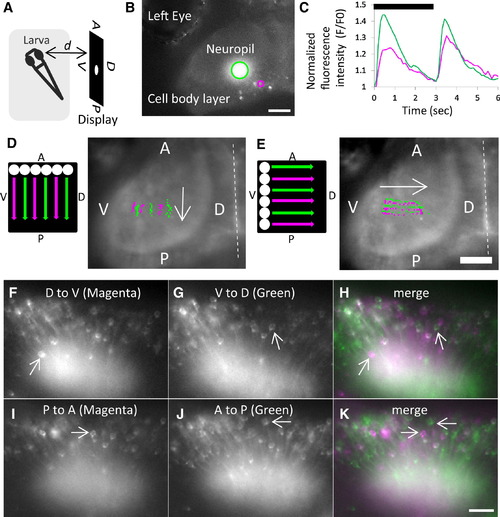
Tectal Responses to Visual Stimuli (A) The recording setup, with the directions of the spot stimulus indicated on a display: A, anterior; P, posterior; D, dorsal; V, ventral. d, distance.(B and C) ON and OFF responses in the optic tectum of a 6 days postfertilization (dpf) larva.(B) Ca2+ signals detected in the neuropil (green) and cell body (magenta). Scale bar represents 50 μm.(C) Normalized fluorescence intensity (F/F0) in the neuropil (green) and cell body (magenta) was increased 0.4–0.5 s after ON and OFF of a spot on the display (Movie S2). The black bar indicates duration (3 s) of appearance (ON) of a spot. d = 15 mm.(D and E) Visuotopic responses in the neuropil of a 7 dpf larva. A spot was moved along the display in the A-to-P (D) and V-to-D (E) directions at a speed of 13.4 mm/s for 1.6 s to create six tracks in parallel. The tracks are colored in magenta and green alternately. The area of Ca2+ signals on the neuropil in each frame (10 frames/s) was defined by setting the threshold manually, and the center of mass was plotted and colored in accordance with the color of the track. The Ca2+ signals moved in the A-to-P (D) and V-to-D (E) directions (indicated by arrows), and their movements recapitulated six tracks on the neuropil. Dashed lines indicate the midline of the larva. Scale bar represents 50 μm. d = 20 mm.(F–K) Identification of direction-selective neurons in the optic tectum of a 5 dpf larva.(F and G) A spot was moved along the D-V axis of the display to create six tracks (with a width of 21.45 mm) in the D-to-V (F) or V-to-D (G) directions.(I and J) A spot was moved along the A-P axis of the display to create four tracks (with a width of 14.3 mm) in the P-to-A (I) and A-to-P (J) directions. Cells responding to D-to-V (F) and P-to-A (I) were colored in magenta, and cells responding to V-to-D (G) and A-to-P (J) were colored in green.(H and K) (F) and (I) were merged with (G) and (J), respectively, and direction-selective neurons were identified (arrows). Scale bar represents 25 μm. d = 15 mm. |
| Gene: | |
|---|---|
| Fish: | |
| Anatomical Terms: | |
| Stage Range: | Day 5 to Days 7-13 |