
|
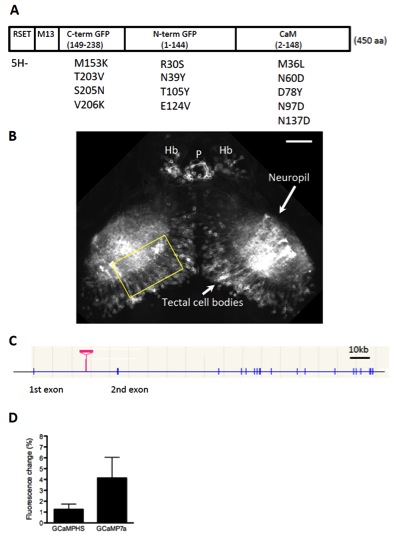
Fig. S1 Expression of GCaMP7a in the Optic Tectum Using the Tectum-Gal4FF Driver Line, Related to Figure 1
(A) The structure of GCaMP7a. Thirteen amino acid substitutions were introduced to GCaMP-HS to generate GCaMP7a. The substitutions are indicated as the amino acid residue in GCaMP-HS (a single letter abbreviation), its position and the new amino acid residue. One amino acid was deleted in the RSET sequence (5H-). In the course of experiments, in addition to GCaMP7a, we tested five other GCaMP variants with amino acid changes in the EF hand motifs of calmodulin; namely, N60D, T26D/T28D/N60D, N60D/N97D/Y99D/S101D, T28D/N60D/N97D/S101D/N137D, and D24S/T28D/N97S/S101D/D133N/N137D; and found that GCaMP7a showed the best performance. RSET: a vector sequence; M13: a calmodulin binding peptide; C-term GFP: COOH-terminal half of EGFP; N-term GFP: NH2-terminal half of EGFP; CaM: calmodulin. (B) Gal4FF expression in the gSA2AzGFF49A transgenic line. Confocal image (a composite of z-series optical sections) of the tectal area in the gSA2AzGFF49A;UAS:membrane-tagged EGFP reporter (channelrhodopsin wide receiver-EGFP; ChRWR-EGFP)[2]. Cell bodies in the tectal neurons and their dendrites that extend into the neuropil area are visualized. Yellow rectangle shows areas shown in Fig. 1A-F. Hb: habenula, P: pineal body. Scale bar: 50 μm. (C) Integration site of the Gal4FF gene trap construct in the gSA2AzGFF49A fish. The Gal4FF gene trap construct was integrated within the first intron of the dlg2 gene on the chromosome 10. (D) Comparison of performance of GCaMPHS and GCaMP7a in vivo. UAS:GCaMPHS and UAS:GCaMP7a fish were crossed with a Gal4 driver gSA2AzGFF49A fish to generate double transgenic larvae. The fluorescence changes during spontaneous activation of the tectal neuropil area in the gSA2AzGFF49A;GCaMPHS (n = 18 calcium transients) larvae and in gSA2AzGFF49A;GCaMP7a larvae (n = 11 calcium transients) were averaged and shown as % change of the fluorescence intensity (mean +/-S.D.).