
- Title
-
Molecular analysis and functions of p53R2 in zebrafish
- Authors
- Shang, H., Li, Q., Feng, G., and Cui, Z.
- Source
- Full text @ Gene
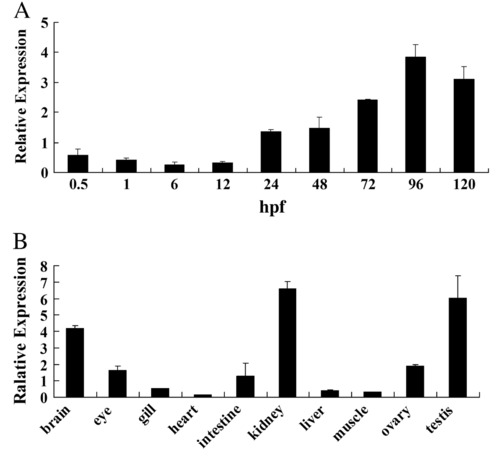
Transcriptional analysis of rrm2b gene in developing embryos and adult tissues of zebrafish. Total RNAs were isolated from embryos and indicated tissues and real-time PCR was then performed. Values are normalized to 18s RNA level and vertical bars represent the mean ± SD (n = 3). (A) Transcriptional expression of rrm2b during embryogenesis. Total RNA was isolated from 30 to 50 embryos at indicated stages. Developing stages are shown as hours post-fertilization (hpf). (B) Expression of rrm2b in adult tissues. Total RNA was isolated from brain, eye, gill, heart, intestine, kidney, liver, muscle, ovary and testis of two adult zebrafish. |
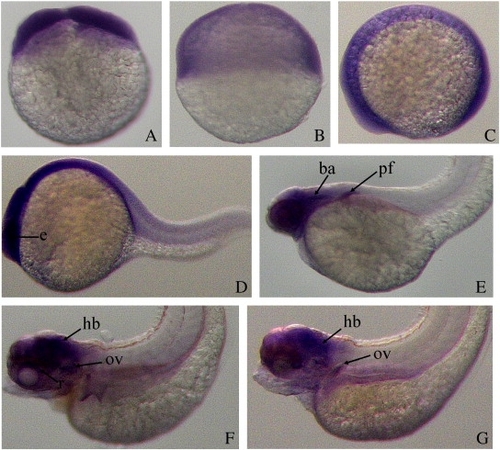
Spatiotemporal expression of rrm2b gene in zebrafish embryos detected with whole-mount in situ hybridization. Developing stages are shown as hours post-fertilization (hpf). (A-B) 1 and 6 hpf, lateral views with animal pole toward the top; (C-G) 12 hpf, 24, 48, 72 and 120 hpf, lateral views with anterior toward the left. Abbreviations: eye (e); branchial arches (ba); pectoral fin (pf); hindbrain (hb), retina (r); otic vesicle (ov). |
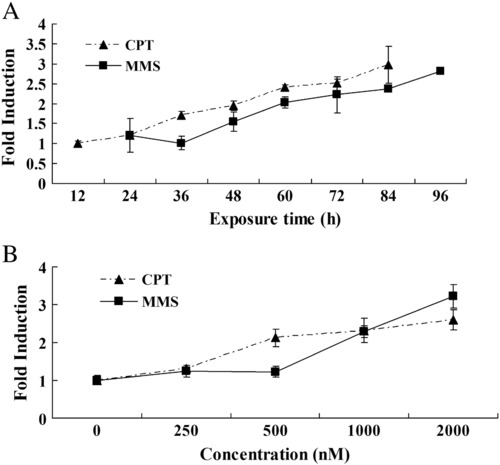
Expression of rrm2b gene in embryos exposed to DNA damage reagents. Total RNA was isolated for real-time PCR analysis and transcriptional expression of β-actin was used as the reference. The ratio of p53R2 to β-actin for untreated embryos in each group was normalized to 1 and data for treated embryos represent relative values of untreated embryos. Data are expressed as means ± SD from three independent experiments. (A) Embryos at 24 hpf were exposed to 250 nM CPT or 550 nM MMS for indicated time intervals. (B) Embryos at 24 hpf were exposed to indicated concentrations of CPT or MMS for 6 h. |
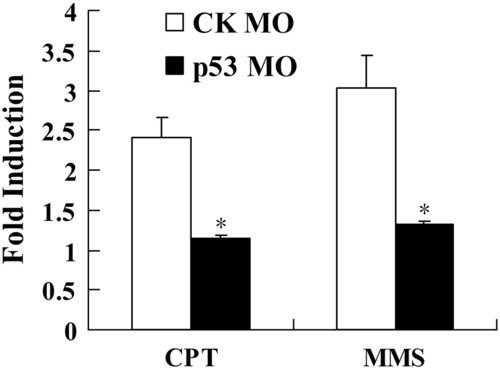
Knockdown of p53 suppresses the DNA damage-induced expression of zebrafish rrm2b gene. Embryos at one-cell stage were injected with 1.5 ng of p53 MO or the standard control (CK) MO. Developing embryos at 24 hpf were treated with 2 µM of CPT or MMS for 6 h and collected for total RNA extraction. Real-time PCR was then performed to determine the expression of p53R2. The ratio of p53R2 to β-actin in untreated embryos was set to 1 in each group, and all treated embryos were normalized relative to this value. Data are expressed as means ± SD from three independent experiments. * indicated p < 0.05 versus the control. EXPRESSION / LABELING:
|
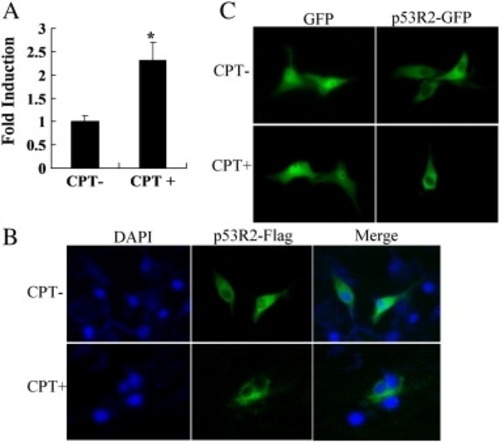
Subcellular localization of zebrafish p53R2. ZF4 cells were transfected with plasmids expressing p53R2-Flag, GFP or p53R2-GFP. 24 h after transfection, cells were treated for 24 h with (CPT+) or without (CPT+) 100 nM CPT and then the following experiments were performed. (A) Real-time PCR analysis of endogenous p53R2 expression. (B) Immunofluorescence staining. Localization of p53R2 was detected with a primary anti-Flag antibody and a FITC-conjugated secondary antibody. Cell nuclei were stained with DAPI. (C) Localization of p53R2-GFP fusion protein in transfected cells was directly visualized under the green channel. Data are expressed as means ± SD from three independent experiments. * indicated p < 0.05 versus the control. |
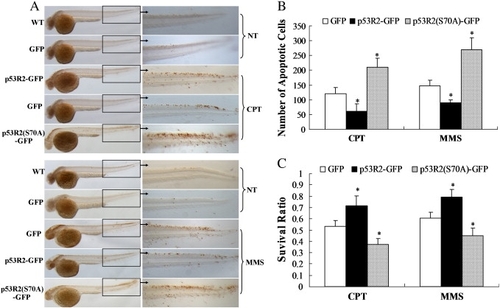
Overexpression of p53R2 suppresses cellular apoptosis and embryonic death caused by DNA damage. Embryos at one-cell stage were injected with 0.2 ng of plasmids expressing GFP, p53R2-GFP or p53R2 (S70A)-GFP. (A). Embryos at 24 hpf were treated with 350 nM CPT for 18 h or 700 nM MMS for 24 h and TUNEL assays were performed with embryos at 42 hpf (upper panel) or 48 hpf (lower panel). Orange dots on embryos represent TUNEL-positive cells. Images are representative of thirty embryos for each group. NT indicates wild type (WT) and GFP-overexpressing embryos without CPT or MMS treatment. (B) Histogram showing the number of apoptotic cells in the tail region. Values represent the mean of total apoptotic cells in one side of the tail region from three representative embryos. The average number of apoptotic cells for NT-WT and NT-GFP groups was about 5–10 and showed no significant difference. (C) Embryos at 24 hpf were treated with 350 nM CPT for 72 h or 700 nM MMS for 96 h and the cumulative survival ratio was shown. Survival ratios for all groups without chemical treatment were 1.The data represent mean ± SD from three independent experiments (100 embryos in triplicates for each experiment). * indicated p < 0.05 versus the GFP-expressing control. |
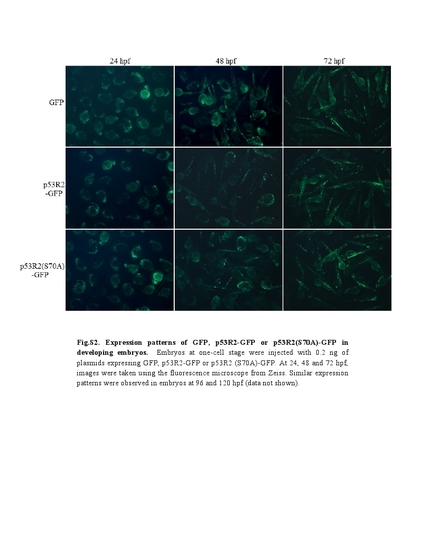
Expression patterns of GFP, p53R2-GFP or p53R2(S70A)-GFP in developing embryos. Embryos at one-cell stage were injected with 0.2 ng of plasmids expressing GFP, p53R2-GFP or p53R2 (S70A)-GFP. At 24, 48 and 72 hpf, images were taken using the flourescence microscope from Zeiss. Similar expression patterns were observed in embryos at 96 and 120 hpf (data not shown). |
Reprinted from Gene, 475(1), Shang, H., Li, Q., Feng, G., and Cui, Z., Molecular analysis and functions of p53R2 in zebrafish, 30-38, Copyright (2011) with permission from Elsevier. Full text @ Gene