
Fig. 7
- ID
- ZDB-FIG-110324-4
- Publication
- Shang et al., 2011 - Molecular analysis and functions of p53R2 in zebrafish
- Other Figures
- All Figure Page
- Back to All Figure Page
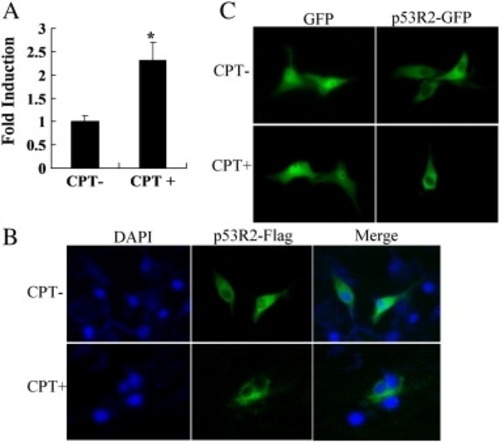
Subcellular localization of zebrafish p53R2. ZF4 cells were transfected with plasmids expressing p53R2-Flag, GFP or p53R2-GFP. 24 h after transfection, cells were treated for 24 h with (CPT+) or without (CPT+) 100 nM CPT and then the following experiments were performed. (A) Real-time PCR analysis of endogenous p53R2 expression. (B) Immunofluorescence staining. Localization of p53R2 was detected with a primary anti-Flag antibody and a FITC-conjugated secondary antibody. Cell nuclei were stained with DAPI. (C) Localization of p53R2-GFP fusion protein in transfected cells was directly visualized under the green channel. Data are expressed as means ± SD from three independent experiments. * indicated p < 0.05 versus the control. |
Reprinted from Gene, 475(1), Shang, H., Li, Q., Feng, G., and Cui, Z., Molecular analysis and functions of p53R2 in zebrafish, 30-38, Copyright (2011) with permission from Elsevier. Full text @ Gene