
|
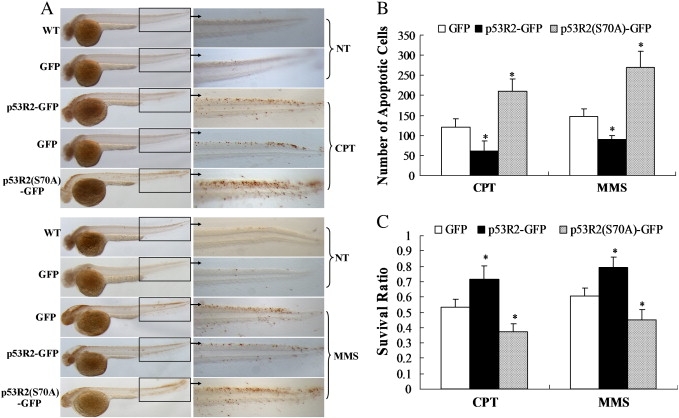
Fig. 8
Overexpression of p53R2 suppresses cellular apoptosis and embryonic death caused by DNA damage. Embryos at one-cell stage were injected with 0.2 ng of plasmids expressing GFP, p53R2-GFP or p53R2 (S70A)-GFP. (A). Embryos at 24 hpf were treated with 350 nM CPT for 18 h or 700 nM MMS for 24 h and TUNEL assays were performed with embryos at 42 hpf (upper panel) or 48 hpf (lower panel). Orange dots on embryos represent TUNEL-positive cells. Images are representative of thirty embryos for each group. NT indicates wild type (WT) and GFP-overexpressing embryos without CPT or MMS treatment. (B) Histogram showing the number of apoptotic cells in the tail region. Values represent the mean of total apoptotic cells in one side of the tail region from three representative embryos. The average number of apoptotic cells for NT-WT and NT-GFP groups was about 5–10 and showed no significant difference. (C) Embryos at 24 hpf were treated with 350 nM CPT for 72 h or 700 nM MMS for 96 h and the cumulative survival ratio was shown. Survival ratios for all groups without chemical treatment were 1.The data represent mean ± SD from three independent experiments (100 embryos in triplicates for each experiment). * indicated p < 0.05 versus the GFP-expressing control.
Reprinted from Gene, 475(1), Shang, H., Li, Q., Feng, G., and Cui, Z., Molecular analysis and functions of p53R2 in zebrafish, 30-38, Copyright (2011) with permission from Elsevier. Full text @ Gene