
|
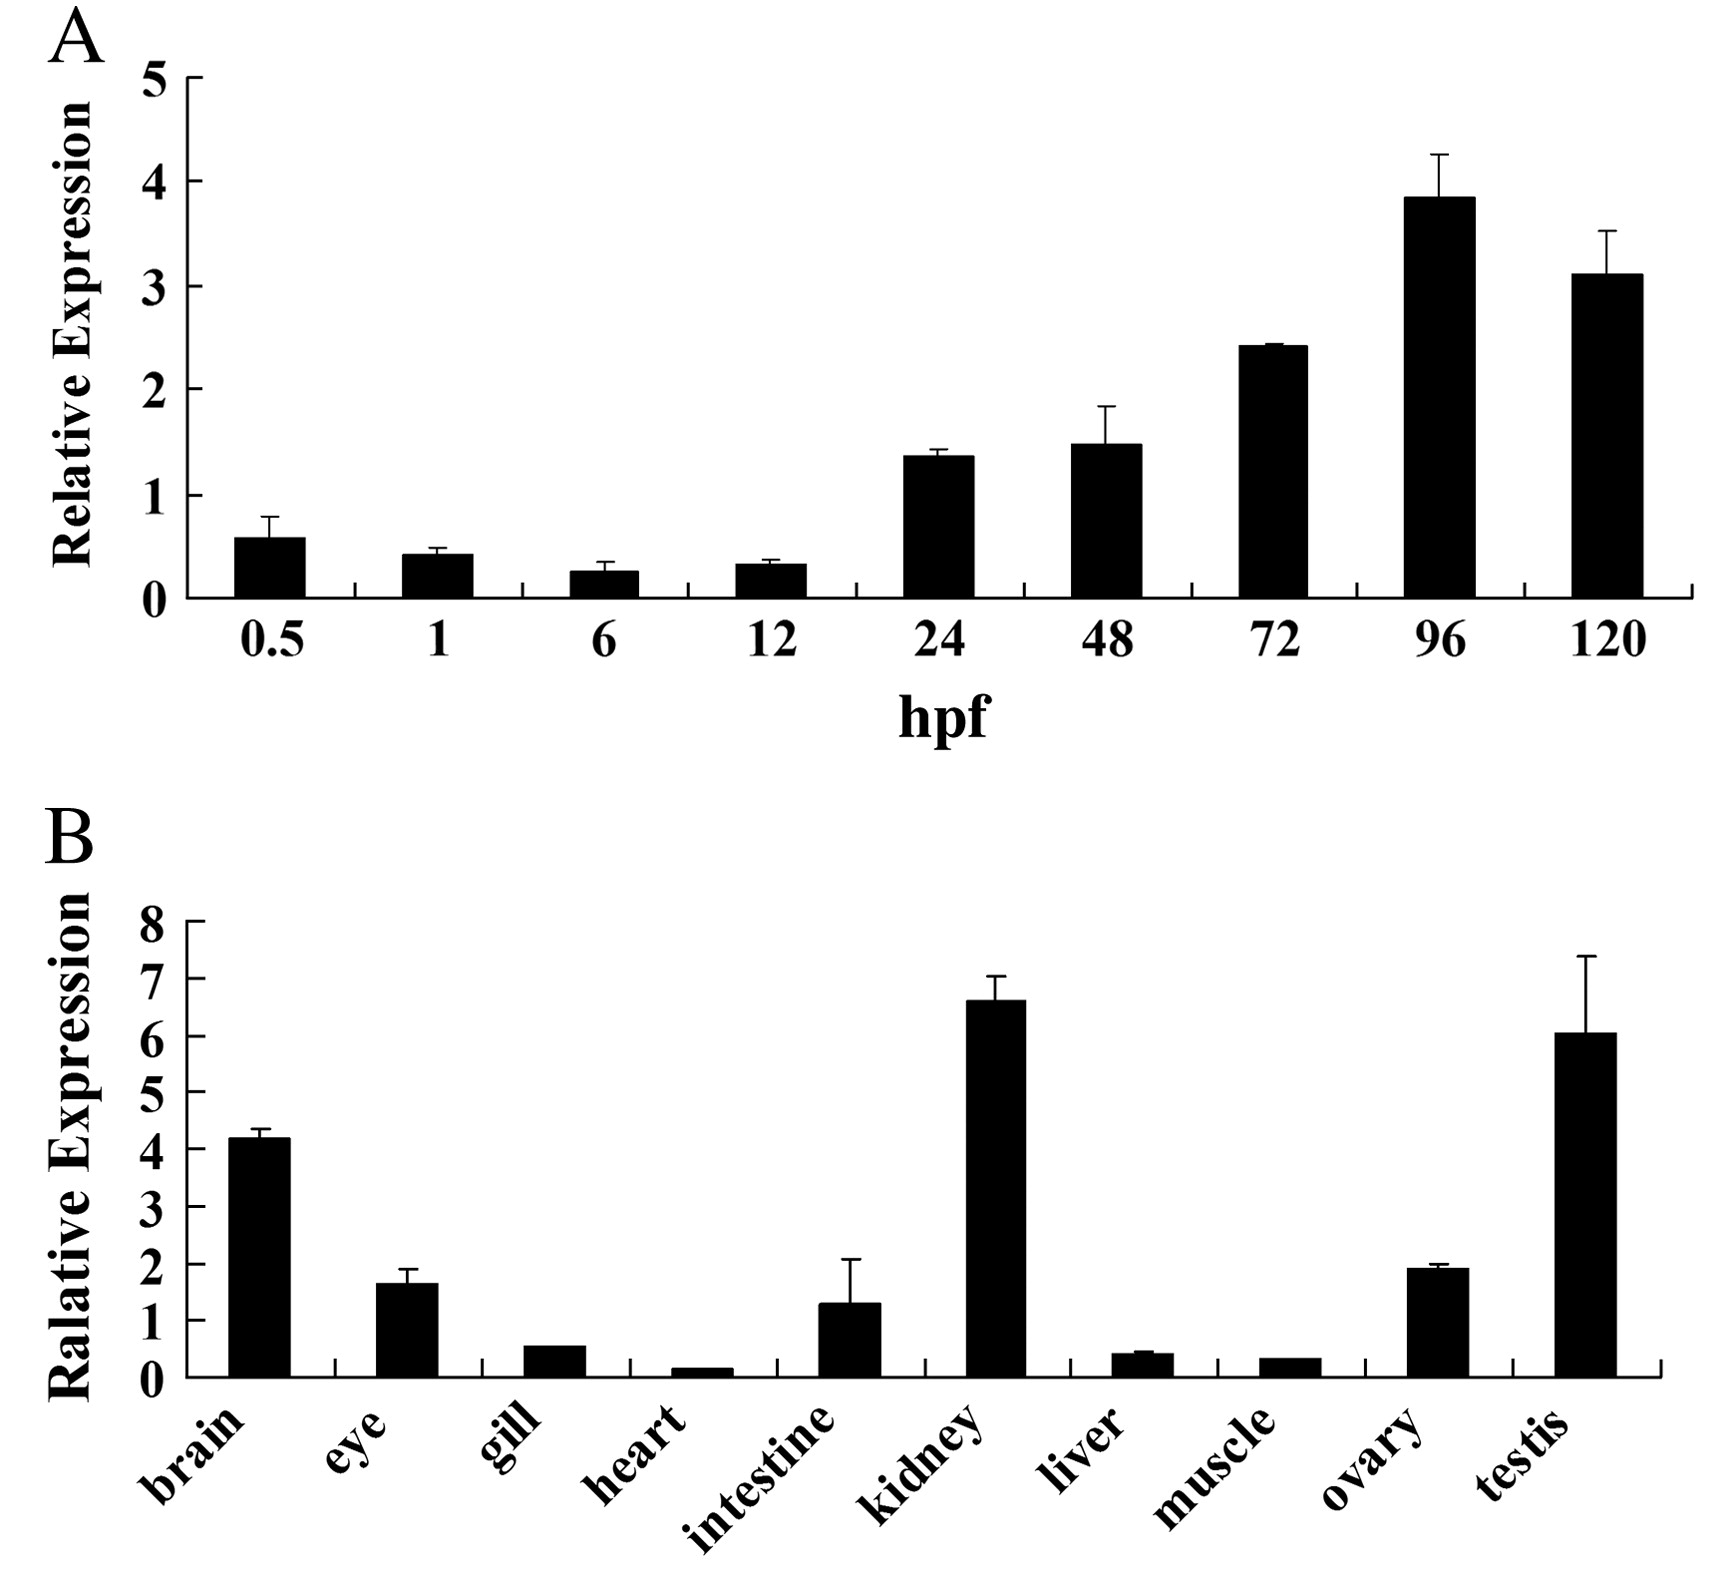
Fig. 2
Transcriptional analysis of rrm2b gene in developing embryos and adult tissues of zebrafish. Total RNAs were isolated from embryos and indicated tissues and real-time PCR was then performed. Values are normalized to 18s RNA level and vertical bars represent the mean ± SD (n = 3). (A) Transcriptional expression of rrm2b during embryogenesis. Total RNA was isolated from 30 to 50 embryos at indicated stages. Developing stages are shown as hours post-fertilization (hpf). (B) Expression of rrm2b in adult tissues. Total RNA was isolated from brain, eye, gill, heart, intestine, kidney, liver, muscle, ovary and testis of two adult zebrafish.
Reprinted from Gene, 475(1), Shang, H., Li, Q., Feng, G., and Cui, Z., Molecular analysis and functions of p53R2 in zebrafish, 30-38, Copyright (2011) with permission from Elsevier. Full text @ Gene