
Image
|
Figure Caption
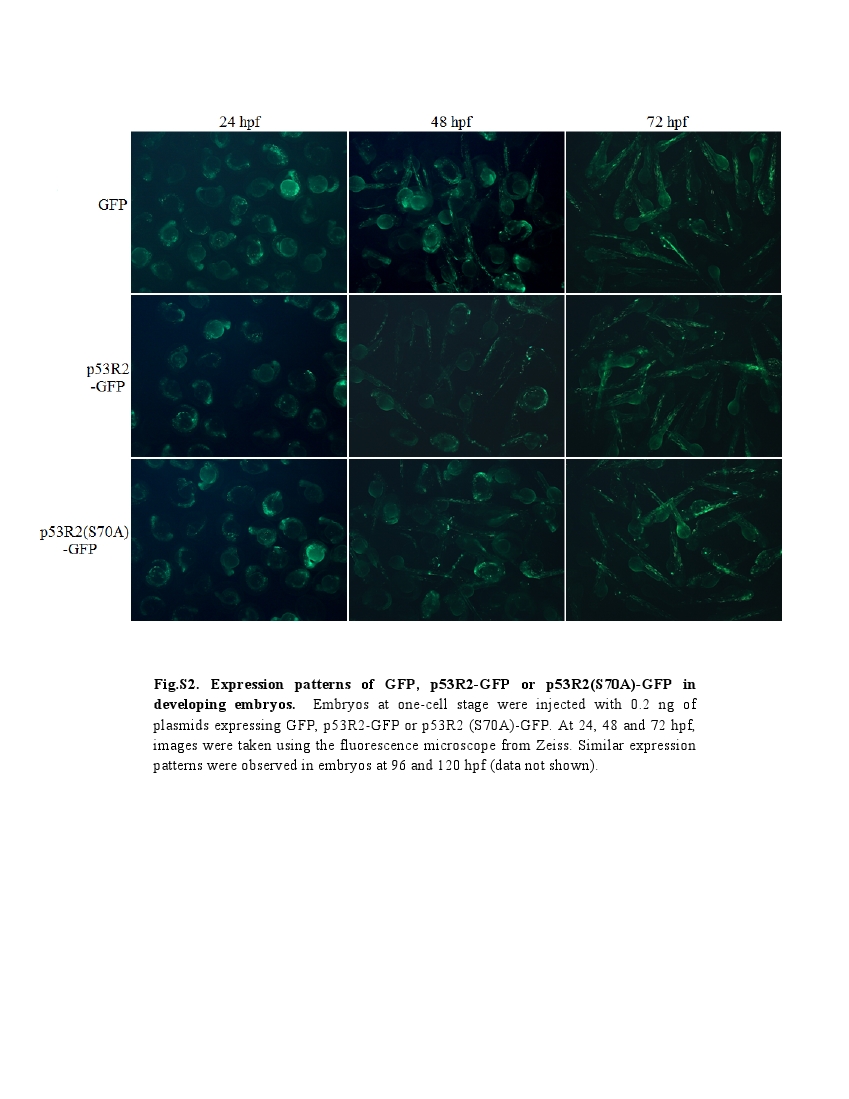
Fig. S2
Expression patterns of GFP, p53R2-GFP or p53R2(S70A)-GFP in developing embryos. Embryos at one-cell stage were injected with 0.2 ng of plasmids expressing GFP, p53R2-GFP or p53R2 (S70A)-GFP. At 24, 48 and 72 hpf, images were taken using the flourescence microscope from Zeiss. Similar expression patterns were observed in embryos at 96 and 120 hpf (data not shown).
Acknowledgments
This image is the copyrighted work of the attributed author or publisher, and
ZFIN has permission only to display this image to its users.
Additional permissions should be obtained from the applicable author or publisher of the image.
Reprinted from Gene, 475(1), Shang, H., Li, Q., Feng, G., and Cui, Z., Molecular analysis and functions of p53R2 in zebrafish, 30-38, Copyright (2011) with permission from Elsevier. Full text @ Gene