
- Title
-
Identification of dendritic antigen-presenting cells in the zebrafish
- Authors
- Lugo-Villarino, G., Balla, K.M., Stachura, D.L., Bañuelos, K., Werneck, M.B., and Traver, D.
- Source
- Full text @ Proc. Natl. Acad. Sci. USA
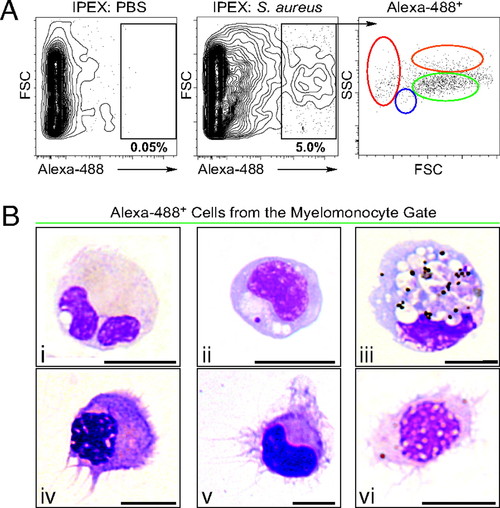
Identification of DCs in zebrafish. (A) PBS (Left) or S. aureus Alexa 488 (Center) was injected i.p., and IPEX cells were collected after 16 h. Phagocytes (black gate, Center) were detected by Alexa 488 fluorescence (5.06 ± 1.84%, n = 11) and separated according to their light-scatter characteristics (Right) as erythrocytes (red gate), lymphocytes (blue gate), myelomonocytes (green gate), or eosinophils (orange gate). (B) IPEX phagocytes within the myelomonocyte gate (green) were isolated (1.1 × 10⁴ ± 962 phagocytes/fish) and subjected to cytospin analysis followed by WG staining. (Upper) Phagocytic myelomonocytes, including neutrophils (i, 40 ± 15%), monocytes, and Mφs (ii and iii, 52 ± 12%). (Lower) DCs (iv-vi, 7 ± 2.5%); n = 6, ± indicates SD. (Scale bar: 5 μm. |
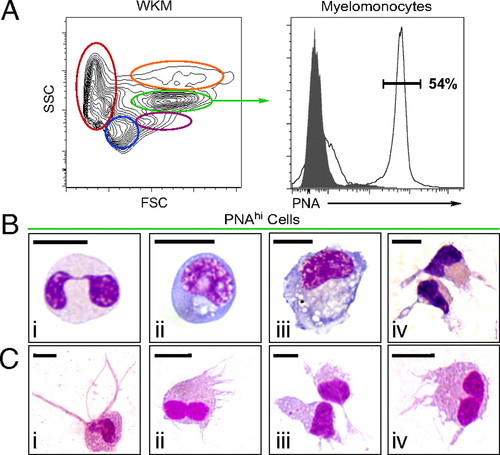
Enrichment of zebrafish DCs by flow cytometry and lectin-binding affinity. Single-cell suspensions were prepared from WKM and labeled with PNA. (A) Contour plot (Left) demonstrates the distribution of cells in WKM by light scatter: erythrocytes (red), lymphocytes (blue), precursors (purple), myelomonocytes (green), and eosinophils (orange). Histogram (Right) shows PNA binding (black unshaded histogram) and negative control (shaded gray histogram) within the myelomonocyte gate. (B) Cytospin analysis of PNAhi myelomonocytes purified from WKM and stained with WG: neutrophils (i), monocytes (ii), Mφs (iii), and DCs (iv). (C) DC-like cells isolated from other organs and peripheral sites based on PNA binding: skin (i), gut (ii), IPEX (iii), and gills (iv). (Scale bar: 5 μm.) |
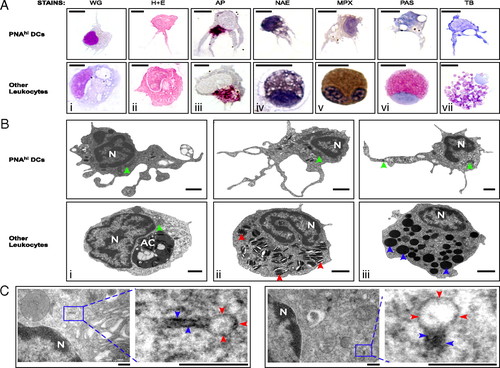
Morphological characterization of zebrafish DCs. PNAhi myelomonocytes were isolated from WKM (A and B) or skin (C) by FACS. (A) Cells were stained for WG, H&E, AP (magenta precipitate), NAE (black precipitate), MPX (brown precipitate), PAS (red precipitate), and TB (purple precipitate). (Upper) Putative DCs for each stain. (Lower) Positive staining controls: Mφs (i-iii), monocyte (iv), neutrophil (v), eosinophil (vi), and mast cell (vii). (Scale bar: 5 μm.) (B) TEM was performed to examine the ultrastructure of PNAhi myelomonocytes. (Upper) DCs. (Lower) Other leukocytes: Mφ (i), neutrophil (ii), and eosinophil (iii). Denoted features include nucleus (N), apoptotic corpse (AC), cigar-shaped granules (red arrowheads), round, electron-dense granules (blue arrowheads), and mitochondria (green arrowheads). (Scale bar: 1 μm.) (C) TEM analysis of Birbeck-like granules from PNAhi DCs in skin. Magnified granule regions: vacuole (red arrowheads) and rod structure (blue arrowheads). (Scale bar: 200 nm.) |
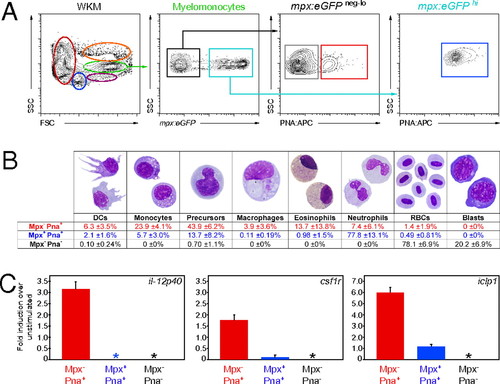
Further enrichment of zebrafish DCs for functional analyses. (A) Single-cell suspensions were prepared from mpx:eGFP transgenic WKM and labeled with PNA. Myelomonocytes (green gate) were divided into mpx- (black box) and mpx+ (blue box). These populations were further subdivided into mpx- PNA- (gray box), mpx- PNA+ (red box), and mpx+ PNA+ (blue box) fractions. (B) After 4 h of culture, mpx- PNA- (gray), mpx- PNA+ (red), and mpx+ PNA+ (blue) fractions were collected and stained with MGG to assess cell morphology. Differentials are presented as mean ± SD, n = 6. (C) mpx- PNA+ (red bar), mpx+ PNA+ (blue bar), and mpx- PNA- (black bar) myelomonocyte fractions were cultured for 16 h with and without LPS. The abundance of il-12p40, csf1r, and iclp1 transcripts were measured by qPCR. Expression is presented as fold induction over nonstimulated controls. Asterisks denote populations with no detectable expression of the transcript. Bars represent mean, n = 3. Error bars represent SD. |