
|
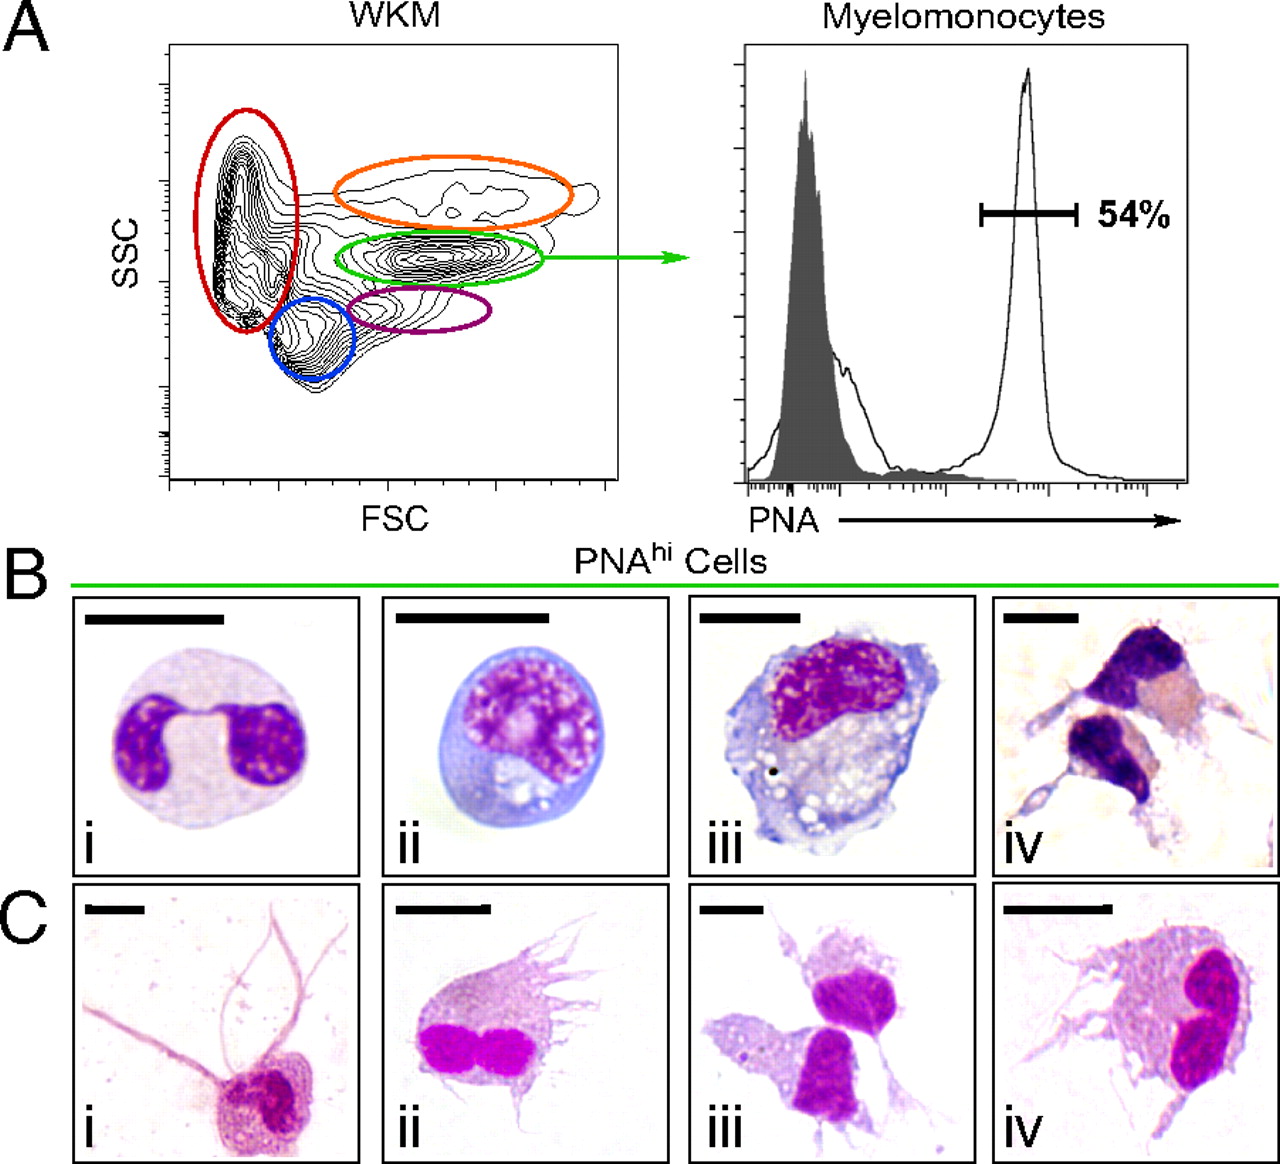
Fig. 2
Enrichment of zebrafish DCs by flow cytometry and lectin-binding affinity. Single-cell suspensions were prepared from WKM and labeled with PNA. (A) Contour plot (Left) demonstrates the distribution of cells in WKM by light scatter: erythrocytes (red), lymphocytes (blue), precursors (purple), myelomonocytes (green), and eosinophils (orange). Histogram (Right) shows PNA binding (black unshaded histogram) and negative control (shaded gray histogram) within the myelomonocyte gate. (B) Cytospin analysis of PNAhi myelomonocytes purified from WKM and stained with WG: neutrophils (i), monocytes (ii), Mφs (iii), and DCs (iv). (C) DC-like cells isolated from other organs and peripheral sites based on PNA binding: skin (i), gut (ii), IPEX (iii), and gills (iv). (Scale bar: 5 μm.)