
Fig. 1
- ID
- ZDB-FIG-101123-24
- Publication
- Lugo-Villarino et al., 2010 - Identification of dendritic antigen-presenting cells in the zebrafish
- Other Figures
- All Figure Page
- Back to All Figure Page
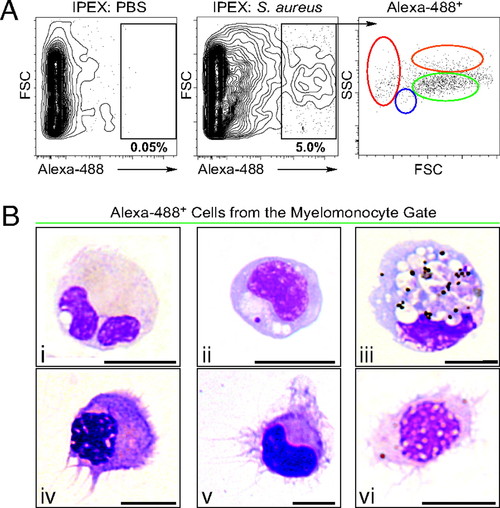
Identification of DCs in zebrafish. (A) PBS (Left) or S. aureus Alexa 488 (Center) was injected i.p., and IPEX cells were collected after 16 h. Phagocytes (black gate, Center) were detected by Alexa 488 fluorescence (5.06 ± 1.84%, n = 11) and separated according to their light-scatter characteristics (Right) as erythrocytes (red gate), lymphocytes (blue gate), myelomonocytes (green gate), or eosinophils (orange gate). (B) IPEX phagocytes within the myelomonocyte gate (green) were isolated (1.1 × 10⁴ ± 962 phagocytes/fish) and subjected to cytospin analysis followed by WG staining. (Upper) Phagocytic myelomonocytes, including neutrophils (i, 40 ± 15%), monocytes, and Mφs (ii and iii, 52 ± 12%). (Lower) DCs (iv-vi, 7 ± 2.5%); n = 6, ± indicates SD. (Scale bar: 5 μm. |