
Fig. 4
- ID
- ZDB-FIG-101123-27
- Publication
- Lugo-Villarino et al., 2010 - Identification of dendritic antigen-presenting cells in the zebrafish
- Other Figures
- All Figure Page
- Back to All Figure Page
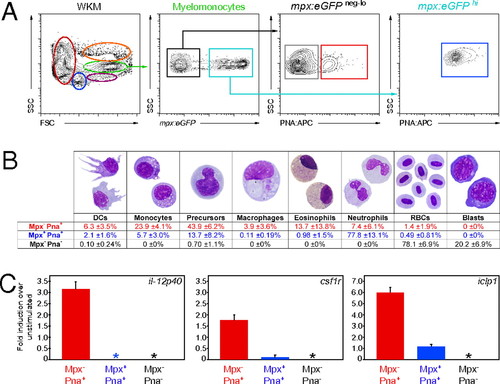
Further enrichment of zebrafish DCs for functional analyses. (A) Single-cell suspensions were prepared from mpx:eGFP transgenic WKM and labeled with PNA. Myelomonocytes (green gate) were divided into mpx- (black box) and mpx+ (blue box). These populations were further subdivided into mpx- PNA- (gray box), mpx- PNA+ (red box), and mpx+ PNA+ (blue box) fractions. (B) After 4 h of culture, mpx- PNA- (gray), mpx- PNA+ (red), and mpx+ PNA+ (blue) fractions were collected and stained with MGG to assess cell morphology. Differentials are presented as mean ± SD, n = 6. (C) mpx- PNA+ (red bar), mpx+ PNA+ (blue bar), and mpx- PNA- (black bar) myelomonocyte fractions were cultured for 16 h with and without LPS. The abundance of il-12p40, csf1r, and iclp1 transcripts were measured by qPCR. Expression is presented as fold induction over nonstimulated controls. Asterisks denote populations with no detectable expression of the transcript. Bars represent mean, n = 3. Error bars represent SD. |