
- Title
-
Inhibition of Plk1 induces mitotic infidelity and embryonic growth defects in developing zebrafish embryos
- Authors
- Jeong, K., Jeong, J.Y., Lee, H.O., Choi, E., and Lee, H.
- Source
- Full text @ Dev. Biol.
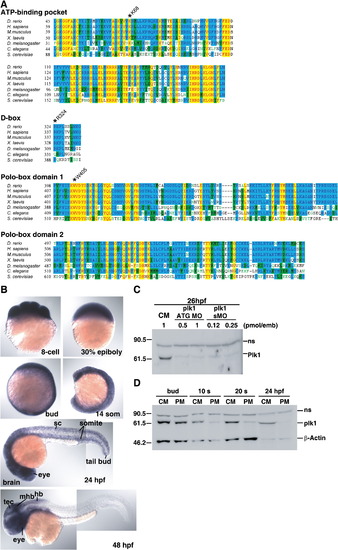
Expression and morpholino-induced knockdown of Plk1 in zebrafish embryos. (A) Alignment of the ATP-binding pockets, D-boxes, and polo-box domains of Plk1 sequences from zebrafish and other species. Amino acid sequences were aligned using Clustal W. Conserved amino acids are highlighted in yellow. Asterisks indicate the mutated residues used in Fig. 7. (B) Analysis of plk1 expression by in situ hybridization in wild-type zebrafish embryos at various developmental stages: hb, hindbrain; mhb, midbrain-hindbrain boundary; sc, spinal cord; tec, tectum. (C) Embryos were injected with the indicated amounts of control MO, plk1 ATG MO, or plk1 sMO in the yolk. Whole embryo lysates were prepared at 26 hpf and subjected to western blot analysis (WB) with anti-human Plk1 antibody. The slower migrating band is a non-specific band (ns). (D) Embryos were injected with 0.5 pmol of control (CM) or plk1 ATG MO (PM), and the whole embryo lysates were subjected to WB with anti-Plk1 antibodies. The same blot was reprobed with anti-β-actin antibodies for a loading control. |
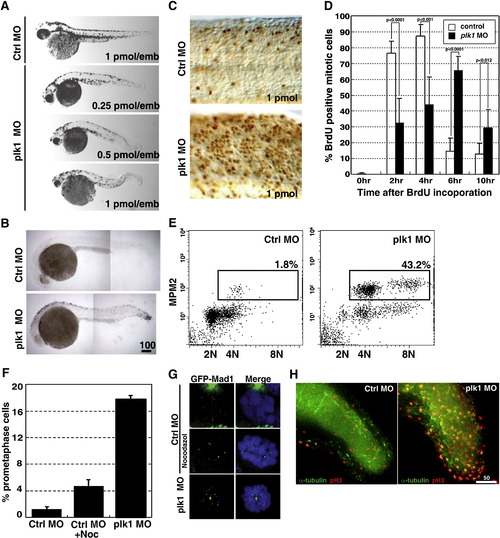
Depletion of Plk1 expression results in growth failure and apoptosis due to activation of SAC. (A) Zebrafish embryos were injected with various concentrations of control (Ctrl) or plk1 ATG MO (Plk1 MO) at the one- to four-cell stages. Photographs were taken at 48 hpf. (B) Embryos were injected with 0.5 pmol of control or plk1 ATG MO, and apoptosis was assayed by TUNEL staining at 28 hpf. Apoptotic cells are shown as purple dots. (C) Embryos were injected with 1 pmol of control or plk1 ATG MO and stained with anti-phosphohistone H3, Ser10 (pH3) antibodies at 24 hpf. (D) Time course from S phase into/out of G2/M, as shown by BrdU incorporation followed by double pH3/BrdU staining at indicated time points post BrdU pulse. Embryos injected with 0.25 pmol of control or plk1 ATG MO are compared. The percentage of BrdU/pH3 double-positive cells are represented in bar graphs (mean ± s.e.m.; n ≥ 385 cells from 2 embryos each). (E) MPM-2 staining for mitotic index measurement. X-axis, 7AAD for DNA staining; Y-axis, MPM-2 staining. (F) Comparison of the percentage of cells with GFP-Mad1 at the prometaphase kinetochores in control, nocodazole-treated, and plk1 MO-injected embryos. The results are the average of two independent experiments. At least 15 embryos each were analyzed in each experiment. (G) Localization of Mad1 at the prometaphase kinetochores in (F). Mad1 localization to kinetochores was not affected by the presence or absence of Plk1. (H) Embryos injected with 0.5 pmol of control or plk1 ATG MO were subjected to co-staining with anti-α-tubulin and anti-pH3 antibodies at 24 hpf. Optical sections were acquired every 1 μm at the end of the tails, merged and deconvoluted. Green, α-tubulin; red, pH3. Scale bar, 50 μm. Enlarged images are presented in Supplemental Fig. S2. |
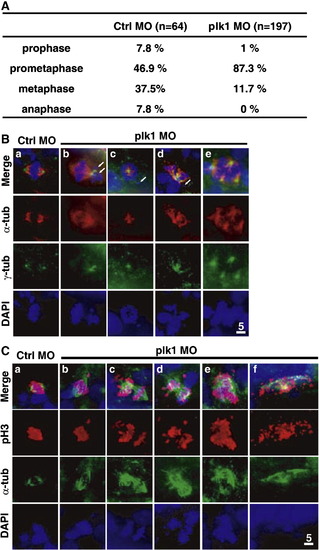
Plk1 depletion leads to prometaphase arrest in zebrafish embryos, accompanied by congression failure and mitotic spindle abnormality. (A) A comparison of the percentage of cells in the indicated stages of mitosis, as judged by the degree of chromosome condensation, nuclear envelope breakdown (NEBD), and chromosome arrangement relative to spindle microtubules. (B) Embryos injected with 0.5 pmol of control or plk1 ATG MO were co-immunostained with anti-α-tubulin and anti-γ-tubulin antibodies at 24 hpf. Red, α-tubulin; green, γ-tubulin. Arrows mark uncongressed chromosomes. (C) Analyses of single cells from the embryos of Fig. 2H (and supplemental Fig. 2). Scale bar, 5 μm. PHENOTYPE:
|
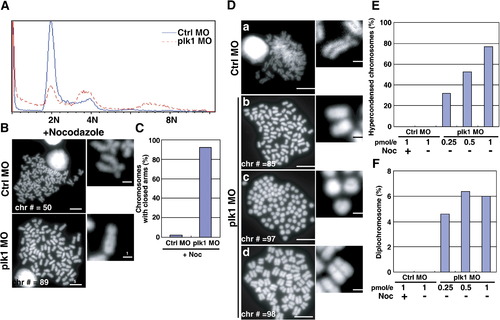
Severe chromosome abnormalities in plk1 morphant embryos. (A) Embryos were injected with 0.25 pmol of control or plk1 ATG MO and single cell suspensions were prepared at 28 hpf. DNA contents were measured by Propidium Iodide (PI) staining and flow cytometry. (B) Metaphase chromosome spreads from control (Ctrl MO) or Plk1 morphants (Plk1 MO). Chromosome numbers (Chr #) and scale bars are indicated. Enlarged images are shown at the right. (C) Chromosomes with closed arms were counted in control or plk1 morphants and compared and represented as percentages in a bar graph. (D) Representative chromosome spreads prepared without nocodazole treatment. Scale bar, 5 μm. (E) The ratio of hypercondensed chromosomes (Dc), scored from 150 metaphase spreads of 20 embryos each. Data from control morphants treated with nocodazole were included for control. (F) The presence of diplochromosomes (Dd) in plk1 morphants. PHENOTYPE:
|
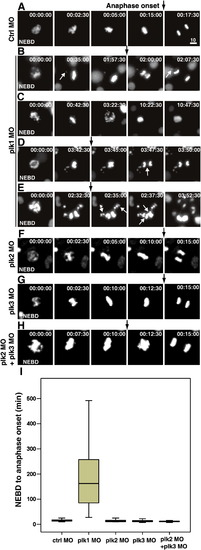
Live-cell imaging reveals that Plk1 is essential in mitotic progression, but Plk2 and Plk3 are dispensable in zebrafish embryos. (A–H) Transgenic zebrafish embryos expressing H2B-GFP were injected with 0.5 pmol of control (A), plk1 ATG MO (B-E), plk2 splicing MO (F), plk3 splicing MO (G), plk2 splicing MO and plk3 splicing MO (H, supplemental movie 8). The surface of the yolk was subjected to time-lapse microscopy, and images were captured every 2.5 min in 22 hpf embryos. The time from NEBD is shown as h:min:s. Black arrows mark the point of anaphase onset. White arrows mark the uncongressed chromosomes in B, lagging chromosomes in D, and multiple metaphase plates in E, respectively. Scale bar, 10 μm. (I) Box plots of mitotic timing, measured from NEBD to the onset of anaphase. At least 30 cells from more than five embryos each were scored. Bars within the boxes are the median values, as determined by statistical analysis using SPSS software. PHENOTYPE:
|
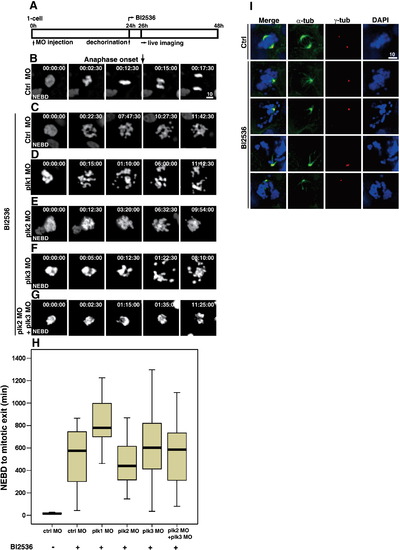
Treatment of 24 hpf embryos with BI 2536, the small molecule inhibitor specific for Plk1, leads to mitotic infidelity and prometaphase arrest. (A) Scheme of BI 2536 treatment in developing zebrafish embryos. Embryos at one-to four-cell stage were injected with indicated morpholino oligos and the drug was treated at 24 hpf. (B) Captured images of cells from the control embryos. The black arrow marks the timing of anaphase onset. The time at NEBD was set to 0. (C–G) Captured images of BI 2536-treated embryos after the injection of indicated morpholinos (supplemental movies 10-14). (H) Box plots of timing from NEBD to mitotic exit. More than 50 cells from at least five embryos each were analyzed. Bars within the boxes are the median values, determined by statistical analysis using SPSS software. Note that BI 2536 treatment in plk1 morphants exhibit more severe phenotype compared to others. (I) Immunofluorescence of the fixed embryos with anti-α-tubulin and -γ-tubulin with or without BI 2536 treatment. Note the monopolar spindles in BI 2536-treated embryos. |
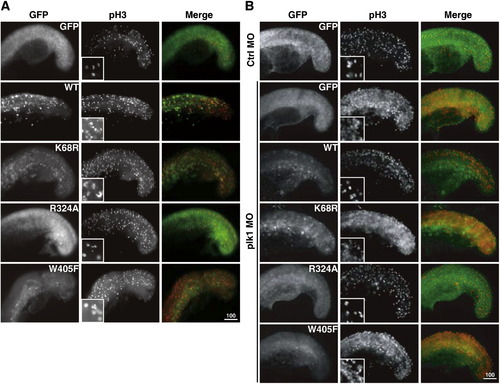
Injection of wild-type Plk1, kinase-dead mutant, D-box mutant, and PBD domain mutant RNAs (illustrated and marked in Fig. 1A) in wild-type and plk1 morphant embryos. Embryos were injected with various GFP-plk1 RNAs alone (A) or in combination with plk1 MO (B). Embryos were collected at the 18-somite stage and stained with anti-pH3 antibodies (red) to assess the effect of the expression of these RNAs on mitosis. Enlarged images of chromosomes stained with anti-pH3 are shown in the inner box for comparison. |
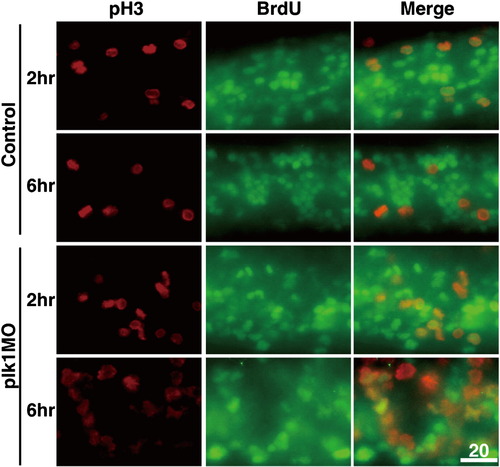
Knockdown expression of Plk1 results in delay in mitosis. Images represent the result from Fig. 2D. Embryos were injected with 0.25 pmol of control or plk1 ATG MO and pulse-labeled with BrdU at 24 hpf for 30 min, washed and incubated for the time points indicated. They were then fixed and co-immunostained with anti-BrdU and anti-pH3 antibodies. Cells double positive for BrdU and pH3 marks the cells in mitosis. |
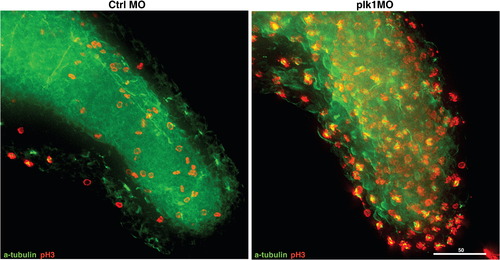
High resolution and enlarged images for Fig. 2H. |
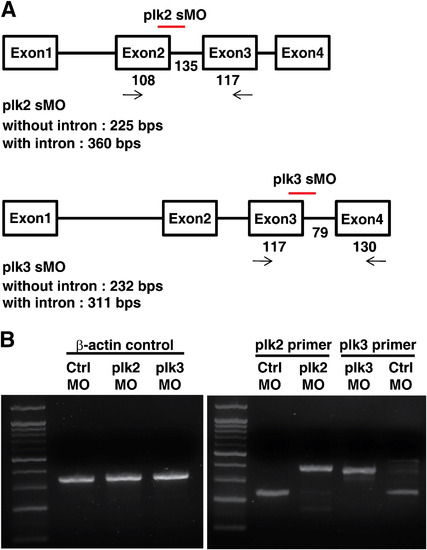
(A) Schematic drawing of the location of Plk2 and plk3 morpholino oligos, respectively, designed and used in this study. These Splicing morpholinos target the boundaries of exon and intron. (B) The efficiencies of the Plk2 MO and Plk3 MO morpholino oligos were confirmed by RT-PCR from embryos after injection. The data shows that the inhibition of splicing around the targeted regions were effective. β-actin was included for control. |
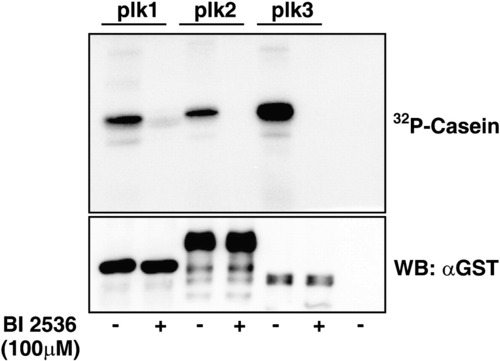
In vitro kinase assay with or without BI 2536. High concentration of BI2536 affects the activities of Plk2 and Plk3 as well as Plk1 in vitro. Bacterially expressed zebrafish Plk1, Plk2 and Plk3 were subjected to in vitro kinase assay. 100μM of BI 2536 efficiently inactivated the kinase activity of all three zebrafish Plks in vitro. |

Unillustrated author statements PHENOTYPE:
|
Reprinted from Developmental Biology, 345(1), Jeong, K., Jeong, J.Y., Lee, H.O., Choi, E., and Lee, H., Inhibition of Plk1 induces mitotic infidelity and embryonic growth defects in developing zebrafish embryos, 34-48, Copyright (2010) with permission from Elsevier. Full text @ Dev. Biol.