
- Title
-
Regulated addition of new myocardial and epicardial cells fosters homeostatic cardiac growth and maintenance in adult zebrafish
- Authors
- Wills, A.A., Holdway, J.E., Major, R.J., and Poss, K.D.
- Source
- Full text @ Development
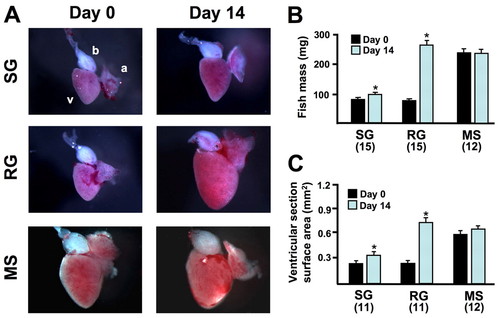
Experimental control of animal and cardiac growth in adult zebrafish. (A) Representative images of hearts collected from animals maintained for 14 days in conditions for rapid growth (RG), slow growth (SG) or to maintain size (MS). Hearts in images may be missing some atrial tissue lost during tissue collection. a, atrium; b, bulbous arteriosus v, ventricle. (B) Quantification of animal mass of RG, SG and MS fish. RG fish had a much higher increase in body mass from day 0 than their SG clutchmates at day 14, whereas MS fish maintained mass (*P<0.001, t-test, significantly different from day 0). The numbers of animals per group are shown in parentheses. (C) Quantification of ventricular size in RG, SG and MS fish. Ventricles in the RG group showed much greater size increases than those of SG clutchmates at day 14, while ventricular size remained stable in MS fish (*P<0.005, t-test, significantly different from day 0). |
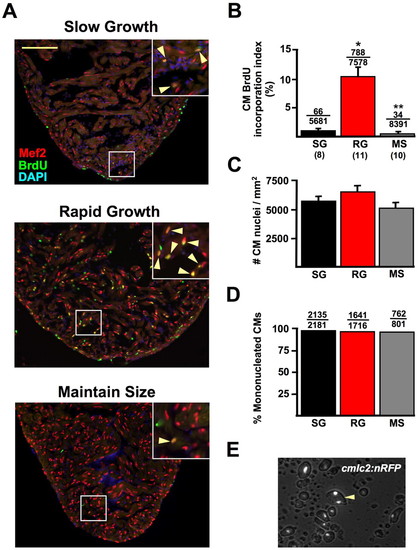
Cardiac homeostasis involves cardiomyocyte hyperplasia. (A) Ventricles from SG, RG and MS animals stained for Mef2 expression to identify CMs (red), and for BrdU incorporation (green). CM BrdU incorporation was much greater in RG ventricles (arrowheads in insets). Nuclei are labeled with DAPI (blue). (B) Quantification of CM BrdU incorporation in SG, RG and MS groups, plotted as the average BrdU incorporation index per animal (*P<0.001, t-test, significantly different from SG; **P<0.05, t-test, significantly different from SG and RG). Numbers above the error bars indicate BrdU-positive CMs over the total CMs counted from all animals combined. Numbers below group abbreviations indicate the number of animals/ventricles per group. (C) CM hypertrophy was assessed by measuring the number of Mef2-positive nuclei per area of myocardium, as described in Materials and methods. No significant differences in CM density were observed between RG ventricles (6540±505 CMs/mm2) and SG (5842±326 CMs/mm2) or MS ventricles (5167±422 CMs/mm2). Eight animals were used per group. (D) Quantification of nuclei in CMs dissociated from pooled cmlc2:nRFP ventricles from different homeostatic conditions, indicating that 97.9% of CMs are mononucleate in SG ventricles, 95.6% in RG ventricles and 95.1% in MS ventricles. (E) Image of dissociated ventricular CMs (cells with white nuclei) from cmlc2:nRFP animals. Binucleated myocytes (arrowhead) are rare in adult zebrafish under RG, SG, or MS conditions. Thus, CM hypertrophy and binucleation play little or no role in homeostatic cardiac growth. Scale bar in A: 100 μm. EXPRESSION / LABELING:
|
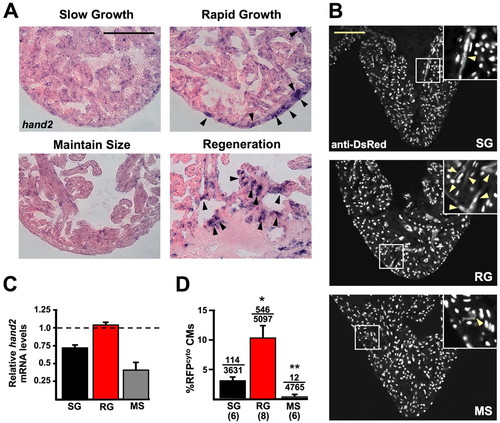
Cardiogenic markers are induced during cardiac homeostasis. (A) hand2 in situ hybridization of ventricular sections. hand2 is weakly expressed in MS hearts, mildly expressed in SG hearts and more strongly expressed in RG hearts similar to regenerating hearts 7 days post-resection (arrowheads show foci of strong expression). (B) Sections from SG, RG and MS ventricles of cmlc2:nRFP zebrafish, stained for DsRed immunoreactivity. RG ventricles show many more RFPcyto cells, a marker that suggests recent CM differentiation events (arrowheads in insets). (C) Real-time Q-PCR analysis of hand2 expression from whole ventricles of SG, RG and MS hearts, relative to expression in ventricles 7 days after apical resection. hand2 expression is similar in ventricles from RG fish to that in regenerating ventricles (1.0, represented by dashed line) and greater than in SG and MS ventricles. (D) Quantification of RFPcyto cells in SG, RG and MS groups. The average RFPcyto index per animal is plotted. Numbers above the error bars indicate RFPcyto CMs over the total CMs counted from all animals combined. Numbers below group abbreviations indicate the number of animals/ventricles per group (*P<0.01, t-test, significantly different from SG; **P<0.005, t-test, significantly different from SG and RG). Scale bars: 100 μm. EXPRESSION / LABELING:
|
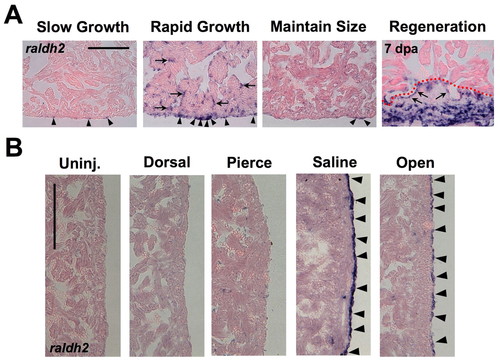
Developmental activation of the epicardium in response to growth or manipulation of the extracardiac environment. (A) Ventricles from SG, RG, or MS animals stained for raldh2 expression. raldh2 is weakly expressed in rare cells of SG and MS epicardia (arrowheads), but strongly expressed in epicardial cells of RG hearts, similar to the expression seen at the wound at 7 days post-amputation (right). Ventricular endocardial cells surrounding inner trabecular myofibers also induced raldh2 during rapid growth, similar to induction during regeneration (arrows in RG and Regeneration). (B) Assessment of raldh2 expression in ventricular epicardium 3 days after different manipulations in 6-month-old MS animals (lateral ventricular wall is shown). Surgically opening the pericardial sac (Open) or injecting saline into the pericardial sac (Saline) stimulated raldh2 expression (arrowheads), whereas injuries to the dorsal side of the animal (Dorsal), or piercing the pericardial sac with an empty needle (Pierce) did not. Scale bars: 100 μm. EXPRESSION / LABELING:
|
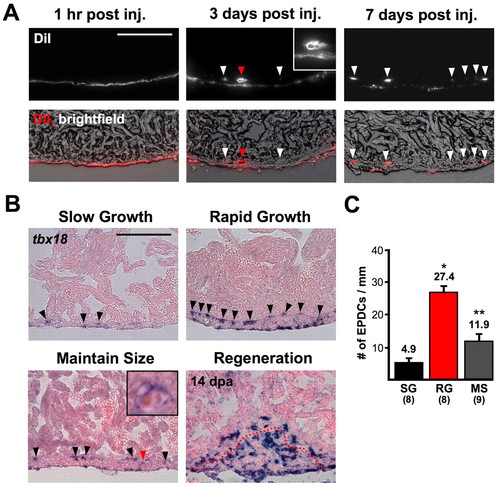
Contribution of epicardial-derived cells (EPDCs) to the ventricular wall. (A) DiI was carefully injected into the pericardial sac to label the epicardium, and hearts were collected at 1 hour, 3 days and 7 days post-injection. Dye is restricted to epicardial cells at 1 hour, but at 3 days EPDCs are occasionally seen in the compact layer (arrowheads). The red arrow indicates labeled tissue with the appearance of vascular tissue (enlarged in the inset). By 7 days post-injection, DiI-containing EPDCs are observed deep in the ventricular wall, with less label within the epicardial layer. Many of these cells appear to contribute to an inner layer of labeled cells ∼15-20 μm into the wall. (B) tbx18 is expressed in many more epicardial cells and EPDCs (arrowheads) in RG animals than in other groups. (Inset) Enlarged image of area indicated by the red arrowhead: some tbx18-positive EPDCs within the ventricle showed a morphology characteristic of vascular cells. The red dotted line in injured animals indicates the border between myocardium and clot material. (C) Quantification of tbx18-positive EPDCs from SG, RG and MS ventricles. (*P<0.001, t-test, significantly different from SG; **P<0.01, t-test, significantly different from RG and SG). Scale bars: 100 μm. EXPRESSION / LABELING:
|
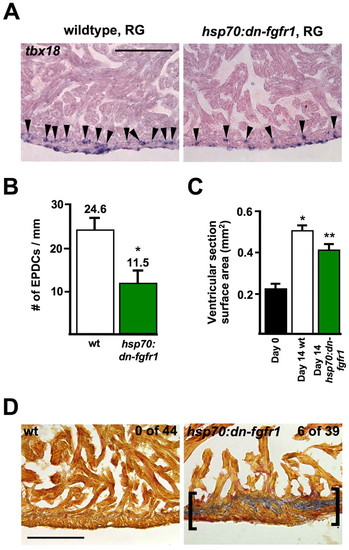
Fgf signaling is required for cardiac homeostasis. (A,B) tbx18 expression in ventricles of wild-type and hsp70:dn-fgfr1 transgenic zebrafish after 14 days RG conditions, with a single daily heat-shock. Although epicardial expression is comparable, significantly fewer EPDCs (arrowheads) are observed within hsp70:dn-fgfr1 ventricular walls (*P<0.001, t-test, n=10). (C) Fgfr inhibition attenuates ventricular growth of RG fish (*P<0.001, t-test, significantly different from day 0; **P<0.01, t-test, significantly different from day 0 and from day 14 wild type, n=9). Day 0 measurements are the results of pooled transgenics and wild types. (D) Acid-fuschin-Orange G staining (AFOG) on ventricles of wild-type and hsp70:dn-fgfr1 animals after 60-70 days of daily heat-shocks. Scars (brackets) were observed in ∼15% of uninjured transgenic fish (n=39), but never observed in wild-type clutchmates given the same daily heat-shock protocol (n=44) (P<0.01, Fisher-Irwin exact test). Scale bars: 100 μm. |
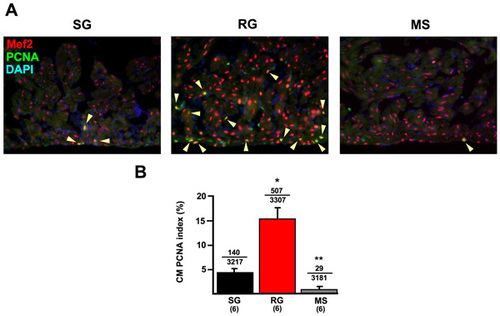
Analysis of PCNA expression in ventricular CMs during growth and size maintenance. (A) Ventricles from SG, RG and MS animals stained for Mef2 expression, to indicate CMs (red) and PCNA expression (green). The CM PCNA index was much greater in RG ventricles (arrowheads in insets). Nuclei are labeled with DAPI (blue). (B) Quantification of CM PCNA index. The average PCNA expression index per animal is plotted (*P<0.005, t-test, significantly different from SG; **P<0.005, t-test, significantly different from SG and RG). Numbers above the error bars indicate PCNA-positive CMs and total CMs counted from all animals combined. Six animals per group were quantified. |
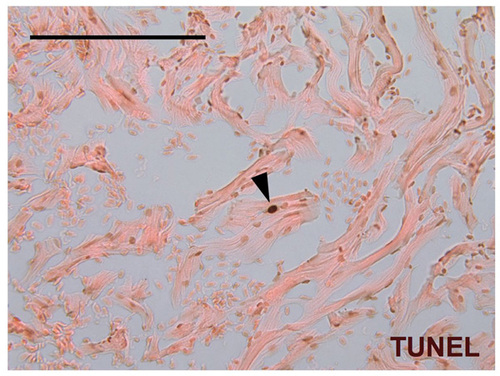
Rare TUNEL-positive CMs in the adult zebrafish ventricle. A single TUNEL-positive CM nucleus (arrowhead) in a ventricular section from a 6-month-old zebrafish, indicative of CM turnover. Scale bar: 100 μm. |