
|
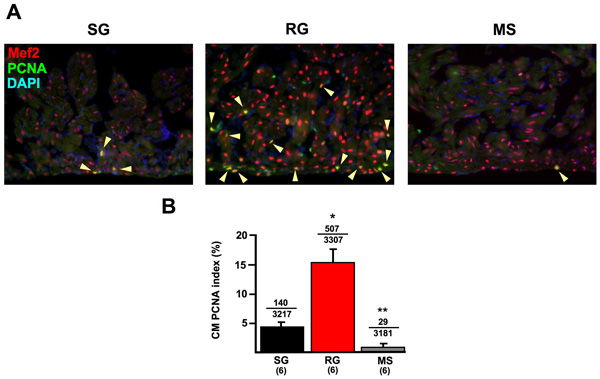
Fig. S1 Analysis of PCNA expression in ventricular CMs during growth and size maintenance. (A) Ventricles from SG, RG and MS animals stained for Mef2 expression, to indicate CMs (red) and PCNA expression (green). The CM PCNA index was much greater in RG ventricles (arrowheads in insets). Nuclei are labeled with DAPI (blue). (B) Quantification of CM PCNA index. The average PCNA expression index per animal is plotted (*P<0.005, t-test, significantly different from SG; **P<0.005, t-test, significantly different from SG and RG). Numbers above the error bars indicate PCNA-positive CMs and total CMs counted from all animals combined. Six animals per group were quantified.