
|
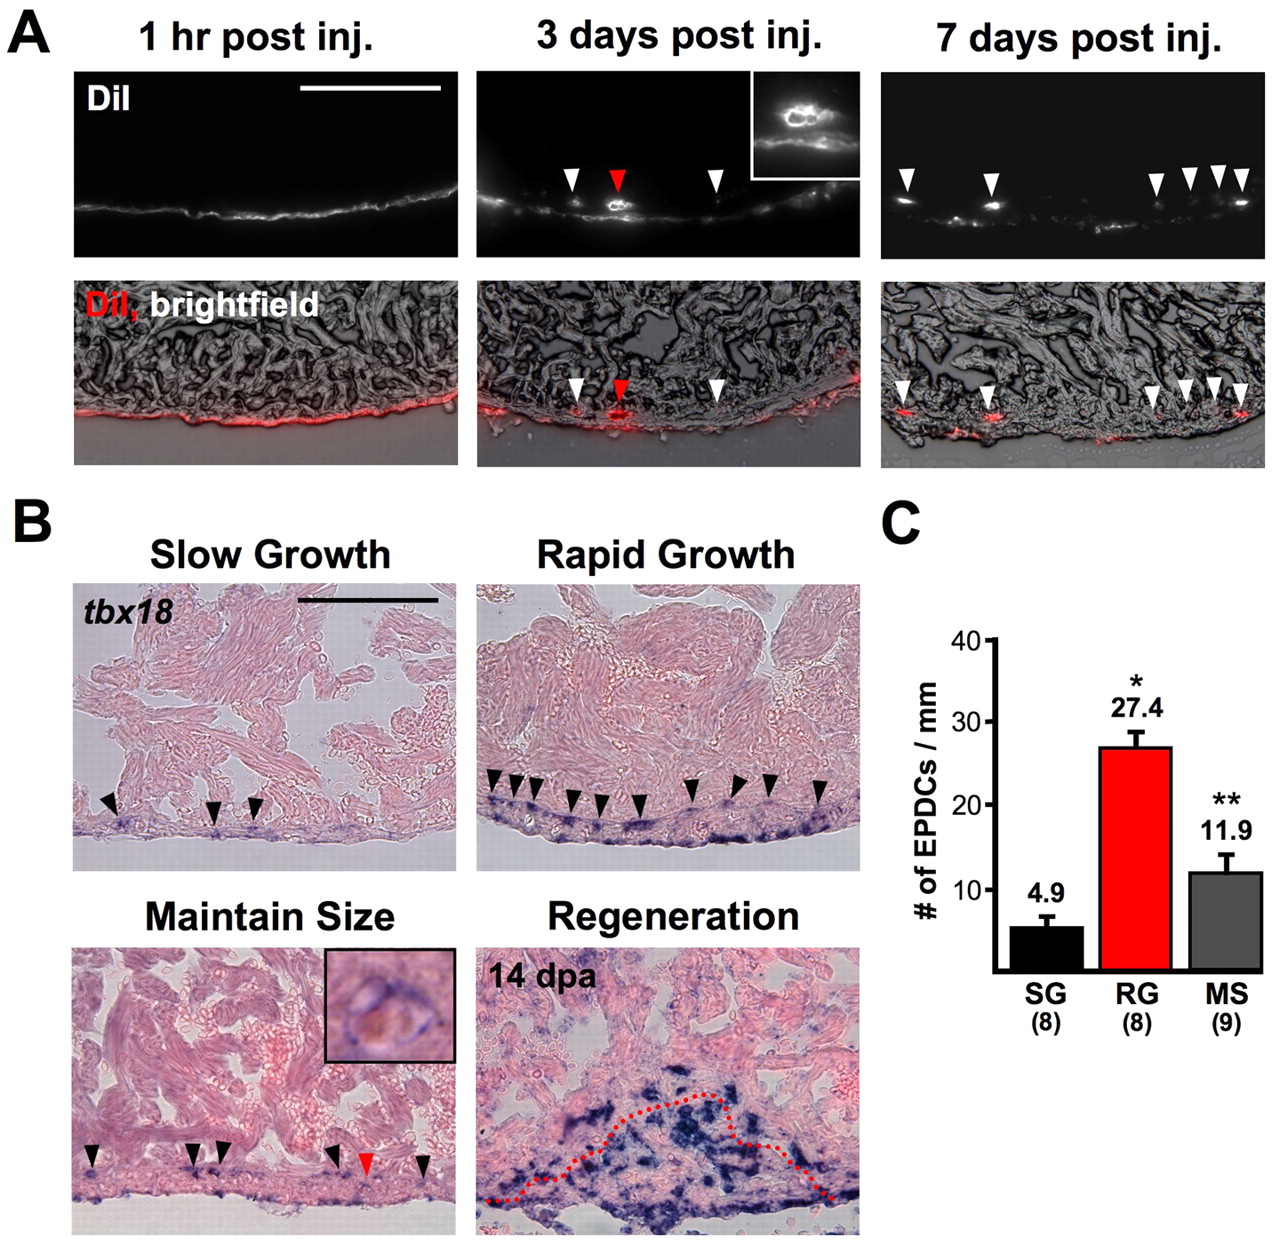
Fig. 5 Contribution of epicardial-derived cells (EPDCs) to the ventricular wall. (A) DiI was carefully injected into the pericardial sac to label the epicardium, and hearts were collected at 1 hour, 3 days and 7 days post-injection. Dye is restricted to epicardial cells at 1 hour, but at 3 days EPDCs are occasionally seen in the compact layer (arrowheads). The red arrow indicates labeled tissue with the appearance of vascular tissue (enlarged in the inset). By 7 days post-injection, DiI-containing EPDCs are observed deep in the ventricular wall, with less label within the epicardial layer. Many of these cells appear to contribute to an inner layer of labeled cells ∼15-20 μm into the wall. (B) tbx18 is expressed in many more epicardial cells and EPDCs (arrowheads) in RG animals than in other groups. (Inset) Enlarged image of area indicated by the red arrowhead: some tbx18-positive EPDCs within the ventricle showed a morphology characteristic of vascular cells. The red dotted line in injured animals indicates the border between myocardium and clot material. (C) Quantification of tbx18-positive EPDCs from SG, RG and MS ventricles. (*P<0.001, t-test, significantly different from SG; **P<0.01, t-test, significantly different from RG and SG). Scale bars: 100 μm.