
- Title
-
Visualizing neurons one-by-one in vivo: optical dissection and reconstruction of neural networks with reversible fluorescent proteins
- Authors
- Aramaki, S., and Hatta, K.
- Source
- Full text @ Dev. Dyn.
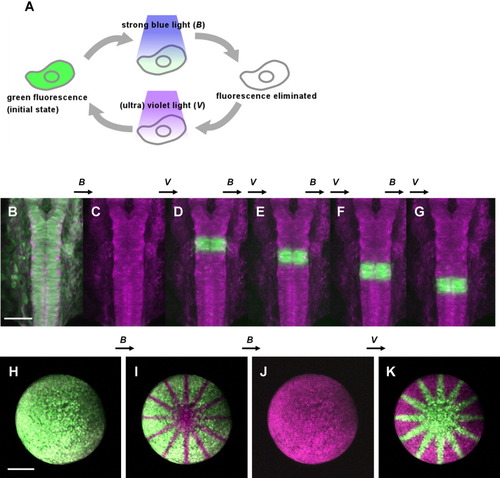
Repeated elimination and reactivation of Dronpa fluorescence, a reversible green fluorescent protein (GFP), with blue and violet lights, in zebrafish in vivo. A: Schematic diagram explaining the reversible nature of Dronpa fluorescent proteins. After synthesis, Dronpa exhibits green fluorescence. This fluorescence is eliminated after exposure to a strong blue light but is recovered after a brief exposure to a (ultra-) violet light. This process can be repeated. B-G: Highlighting rhombomeres one after another in the same embryo at 19 hours postfertilization (hpf). Anterior is to the top. Dorsal view of the hindbrain of an embryo that expresses Dronpa and membrane-bound monomeric red fluorescent protein (mRFP) after co-injection of the corresponding synthesized RNAs at the single cell stage. Dronpa is a fluorescent green color, and mRFP is a fluorescent red color. All images have been pseudo-colored magenta. B: The embryo is initially doubly fluorescent in green and red. C: Scanning with a strong 488-nm laser eliminated entirely the green fluorescence. D-G: Rhombomere 4 was scanned with the 405-nm laser. This specifically re-highlighted the area in green. By repeating this process, we could highlight rhombomeres 4, 5, 6, and 7 one at a time. Note that the red fluorescence of mRFP is not affected during these procedures. H-K: Imprinting an identical pattern but in reversed color combinations on the same embryo. The embryo was at the stage of 50% epiboly to early gastrula (5-6 hpf). Each of two alternative methods based on either elimination with blue light or reactivation with (ultra-) violet light. I: Twelve radial lines were first imprinted on the embryo expressing Dronpa and mRFP by eliminating the green fluorescence by scanning with a strong 488-nm laser in this pattern. J,K: The embryo was then scanned with the strong 488-nm laser entirely (J), then, with the 405-nm laser in the same pattern of radiation (K). The arrow marked B indicates exposure to the blue light, and V indicates exposure to the (ultra-) violet. See also Supplementary Movies S1a and S1b. Scale bars = 100 μm in B, 200 μm in I. |
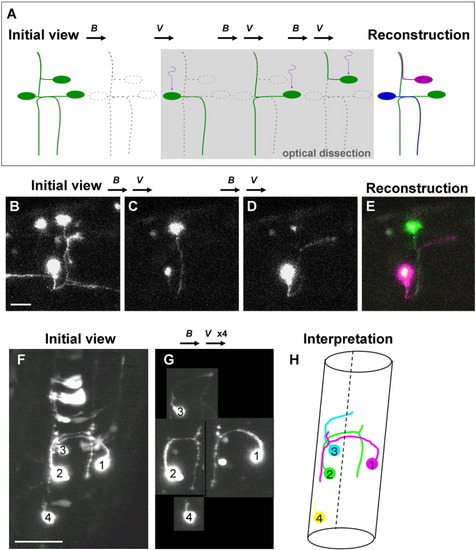
Visualization of individual neurons one-by-one: optical dissection and reconstruction of neural networks using Dronpa. A: Schematic representation of the technique used for optical dissection of individual neurons from a network. The entire visual field, including multiple neurons expressing fluorescent Dronpa, was irradiated with blue light (B) to eliminate the fluorescence. The position of the single soma is locally irradiated with (ultra-) violet light (V). The fluorescence in the soma is specifically reactivated and diffused into the neurites. By repeating the same procedure three times on a different neuronal soma each time, we were able to visualize and trace individual neurons. The network can then be reconstructed with each neuron labeled in a different pseudo-color. B-E: As an example, for mosaic expression of Dronpa in the neurons, pUD was injected into the Tg(DeltaD:Gal4) fish at the one- to four-cell stage. Dorsolateral view of the hindbrain. Anterior is to the right. B: There were several neurons expressing Dronpa extending axons that are intermingled with each other. The entire brain was first scanned with a strong 488-nm laser to eliminate most of the fluorescence. Note that rudimental fluorescence remained in some neuronal somas. A single soma of the neuron was then irradiated with the 405-nm laser. C: Anterograde diffusion of the fluorescent Dronpa specifically visualized the neurites of this neuron. D: This procedure was repeated, but a different neuronal soma was irradiated. E: By adding different pseudo-colors (green and magenta) to these two neurons using LSM510 (Zeiss), we reconstructed the network, revealing that these two neurons were ascending commissure neurons that cross at the midline of each other. F-H: Another example. The caudal hindbrain of an embryo at 26 hours postfertilization (hpf) prepared similarly as above. Dorsal view. Anterior is to the top. Several neurons were intermingled, and the morphology of each neuron was obscure. G: After repeating complete elimination and local reactivation of the fluorescence four times (B,Vx4), the shape of each neuron became evident. Neurons 1 and 2 were T-shaped commissure neurons. Neuron 3 was an ascending commissure neuron. Neuron 4 was starting to extend its neurite anteriorly. H: We could interpret the network constructed by these four neurons. The broken line represents the ventral midline, where the floor plate resides. See also Supplementary Movies S2a and S2b. Scale bars = 20 μm in B, 50 μm in F. |
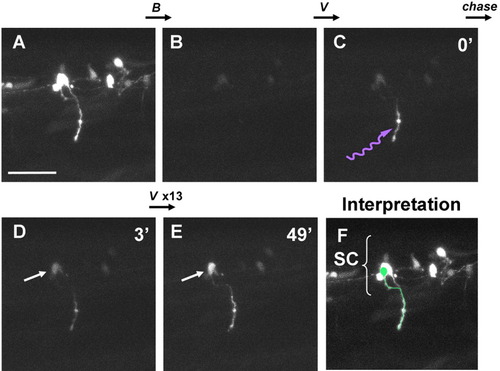
Retrograde labeling from axon to soma using Dronpa. A: Mixtures of motoneurons and interneurons in the spinal cord expressing fluorescent Dronpa at 27 hours postfertilization (hpf), as prepared in Figure 2. Anterior is to the right. Dorsal is to the top. B: The image after scanning the entire visual field several times with the strong 488-nm laser. Fluorescence was mostly eliminated. C: The image immediately after scanning with the 405-nm laser (violet waved arrow) of a small portion of the spinal nerve innervating the body muscle. D: The image 3 min after irradiation. Retrograde diffusion of the re-highlighted fluorescent Dronpa revealed the shape of the axon and the position of the soma (arrow) previously hidden by a few interneurons partially overlapped in view A. E: The image after repeated irradiation and diffusion for 13 times (49 min after the initial irradiation). The shape of the neuron is more clearly distinguishable. F: Outline of the neuron (in green), interpreted and drawn on the same photo as A. SC, spinal cord. See also Supplementary Movie S3. Scale bar = 50 μm. |
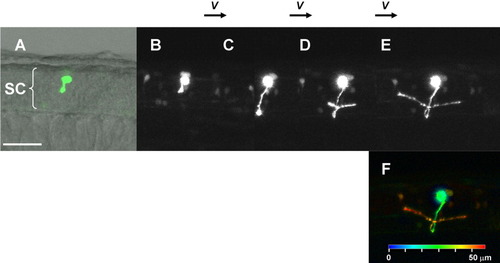
Time-lapse imaging of neural development using Dronpa. A: A single neuron expressing Dronpa starting to extend axon at 27 hours postfertilization (hpf). Anterior is to the left. B-E: Time-lapse series of axonal navigation of the T-shaped commissural spinal neuron imaged at 27 hpf (B), 31 hpf (C), 39 hpf (D), and 42 hpf (E). The axon extended ventrally (B), crossed the midline (C), reached the contralateral side, and bifurcated both anteriorly and posteriorly (D). The neuron was irradiated with the 405-nm laser, immediately after every three time points for observation. This strategy resulted in recovery of the weakening fluorescence caused by observation using the laser with the same wavelength for the elimination. F: Depth pseudo-color code representation of the neuron at 42 hpf, showing the three-dimensional structure of the neuron. The scale for the depth is shown at the bottom. See also Supplementary Movie S4. Scale bar = 50 μm. |
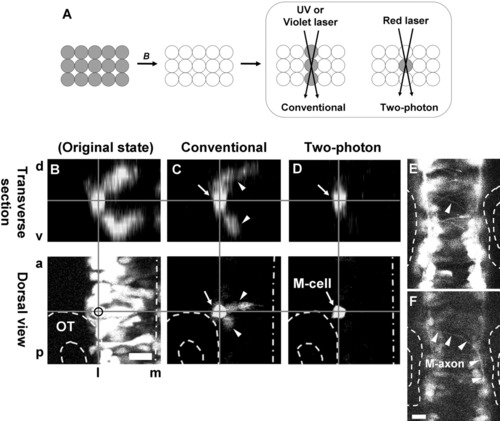
Labeling of a single neuron located inside of the brain using Dronpa by two-photon confocal microscopy: Visualization of a Mauthner cell. A: Schematic representation of the comparison between the results of photoreactivation of Dronpa in a layered tissue by conventional or two-photon confocal microscopy. The former results in the label as a column, whereas the latter results in the label specifically in the focused cells. All cells initially expressing Dronpa are fluorescent green in color. After scanning with strong blue laser (B), the fluorescence is eliminated. Scanning on the cell of interest with (ultra-) violet laser reactivates the fluorescence, not only in the cell of interest but also in the neighboring cells along the path of the laser. Conversely, by using two-photon confocal microscopy, the cells in focus can be specifically labeled, as red laser cannot reactivate the fluorescence of Dronpa and the two-photon event that is required to reactivate the fluorescence is limited to the focal plane. B: Confocal observation of the hindbrain near the otic vesicle (OT, outlined with broken lines), expressing Dronpa with the 488-nm laser. The embryo is a double-hetero transgenic of Tg(dld:Gal4) and Tg(UAS:dronpa) at around stage 21 hours postfertilization (hpf). Dorsal view (a projection of 14 optical slices taken at the interval of 5.4 μm) is at the bottom, and an optically reconstructed transverse section is on the top. d, dorsal; v, ventral; a, anterior; p, posterior; m, medial; l, lateral. The midline of hindbrain is indicated by long dashed dotted line. C: The same specimen after an attempt at re-highlighting a neuron inside of the brain by conventional confocal microscopy. The specimen was first scanned repeatedly with the strong 488-nm laser to eliminate entire fluorescence in the area, then scanned twice at the center of a chosen neuron with 405 nm by conventional confocal microscope. These scans were made from the dorsal side. The cell was highlighted, but the fluorescence of the dorsally and ventrally neighboring cells along the laser path (arrowheads) were also activated to obtain sufficient brightness at the target cell. D: The same specimen after the successful re-highlighting of a single neuron inside of the brain by two-photon microscopy. It was located at the middle of rhombomere 4 near the anterior edge of the otic vesicle (outlined). After elimination of the fluorescence as described above, specimen was scanned repeatedly (1,000 times) at the center of the chosen neuron with 780 nm by two-photon confocal microscopy from the dorsal side. The cell was highlighted without activating the fluorescence of the dorsally and ventrally neighboring cells along the laser path. E: An optical slice of B at the floor of the hindbrain, with enhanced brightness and contrast, demonstrating numerous axons and growth cones crossing the midline. The axon from the left Mauthner neuron is indicated by arrowhead. F: An optical slice of C at the floor of the hindbrain, demonstrating a single axon crossing the midline (M-axon, arrowheads), gradually turning posteriorly and joining the contralateral medial longitudinal track, confirming that the single cell we labeled was indeed the left Mauthner neuron (M-cell in D). Scale bars = 20 μm. |