
|
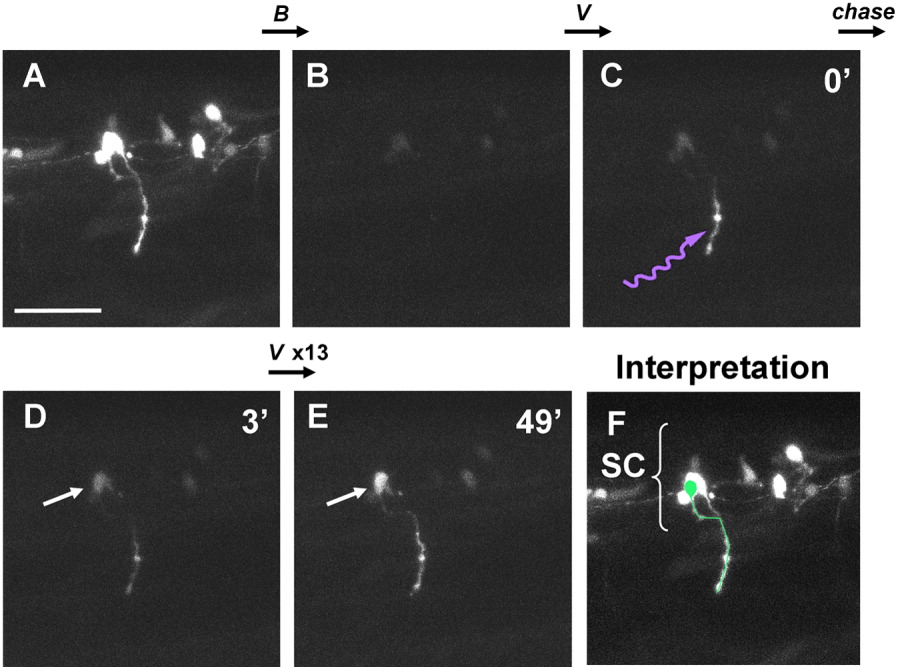
Fig. 3 Retrograde labeling from axon to soma using Dronpa. A: Mixtures of motoneurons and interneurons in the spinal cord expressing fluorescent Dronpa at 27 hours postfertilization (hpf), as prepared in Figure 2. Anterior is to the right. Dorsal is to the top. B: The image after scanning the entire visual field several times with the strong 488-nm laser. Fluorescence was mostly eliminated. C: The image immediately after scanning with the 405-nm laser (violet waved arrow) of a small portion of the spinal nerve innervating the body muscle. D: The image 3 min after irradiation. Retrograde diffusion of the re-highlighted fluorescent Dronpa revealed the shape of the axon and the position of the soma (arrow) previously hidden by a few interneurons partially overlapped in view A. E: The image after repeated irradiation and diffusion for 13 times (49 min after the initial irradiation). The shape of the neuron is more clearly distinguishable. F: Outline of the neuron (in green), interpreted and drawn on the same photo as A. SC, spinal cord. See also Supplementary Movie S3. Scale bar = 50 μm.