
|
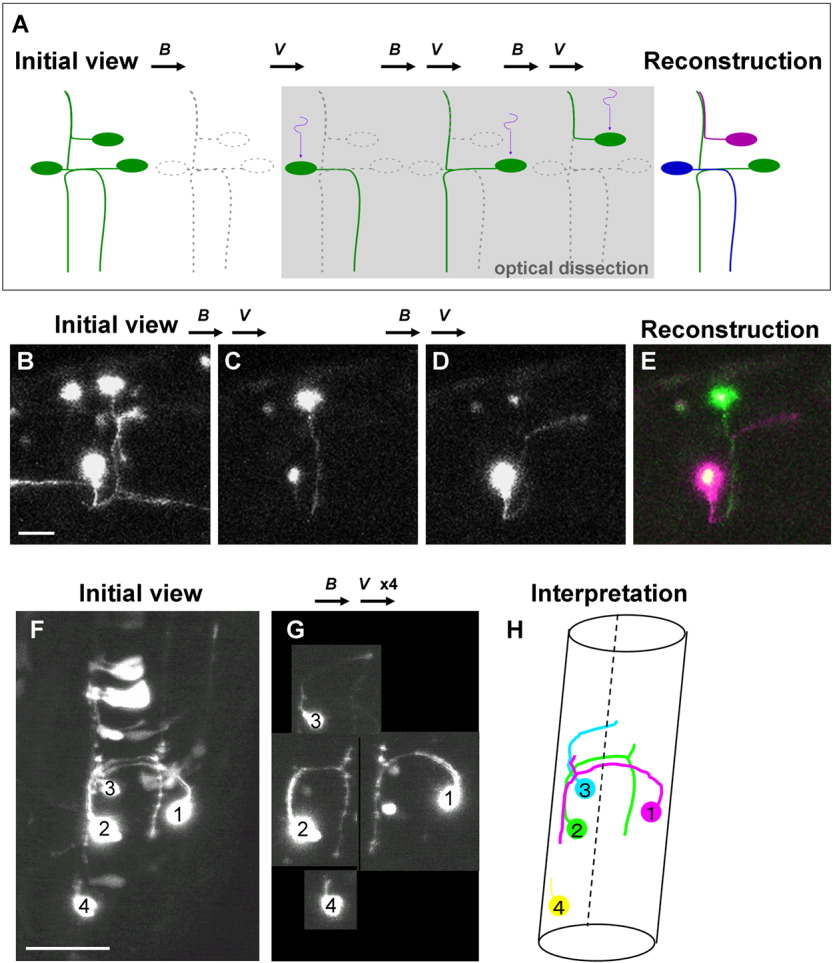
Fig. 2 Visualization of individual neurons one-by-one: optical dissection and reconstruction of neural networks using Dronpa. A: Schematic representation of the technique used for optical dissection of individual neurons from a network. The entire visual field, including multiple neurons expressing fluorescent Dronpa, was irradiated with blue light (B) to eliminate the fluorescence. The position of the single soma is locally irradiated with (ultra-) violet light (V). The fluorescence in the soma is specifically reactivated and diffused into the neurites. By repeating the same procedure three times on a different neuronal soma each time, we were able to visualize and trace individual neurons. The network can then be reconstructed with each neuron labeled in a different pseudo-color. B-E: As an example, for mosaic expression of Dronpa in the neurons, pUD was injected into the Tg(DeltaD:Gal4) fish at the one- to four-cell stage. Dorsolateral view of the hindbrain. Anterior is to the right. B: There were several neurons expressing Dronpa extending axons that are intermingled with each other. The entire brain was first scanned with a strong 488-nm laser to eliminate most of the fluorescence. Note that rudimental fluorescence remained in some neuronal somas. A single soma of the neuron was then irradiated with the 405-nm laser. C: Anterograde diffusion of the fluorescent Dronpa specifically visualized the neurites of this neuron. D: This procedure was repeated, but a different neuronal soma was irradiated. E: By adding different pseudo-colors (green and magenta) to these two neurons using LSM510 (Zeiss), we reconstructed the network, revealing that these two neurons were ascending commissure neurons that cross at the midline of each other. F-H: Another example. The caudal hindbrain of an embryo at 26 hours postfertilization (hpf) prepared similarly as above. Dorsal view. Anterior is to the top. Several neurons were intermingled, and the morphology of each neuron was obscure. G: After repeating complete elimination and local reactivation of the fluorescence four times (B,Vx4), the shape of each neuron became evident. Neurons 1 and 2 were T-shaped commissure neurons. Neuron 3 was an ascending commissure neuron. Neuron 4 was starting to extend its neurite anteriorly. H: We could interpret the network constructed by these four neurons. The broken line represents the ventral midline, where the floor plate resides. See also Supplementary Movies S2a and S2b. Scale bars = 20 μm in B, 50 μm in F.