
|
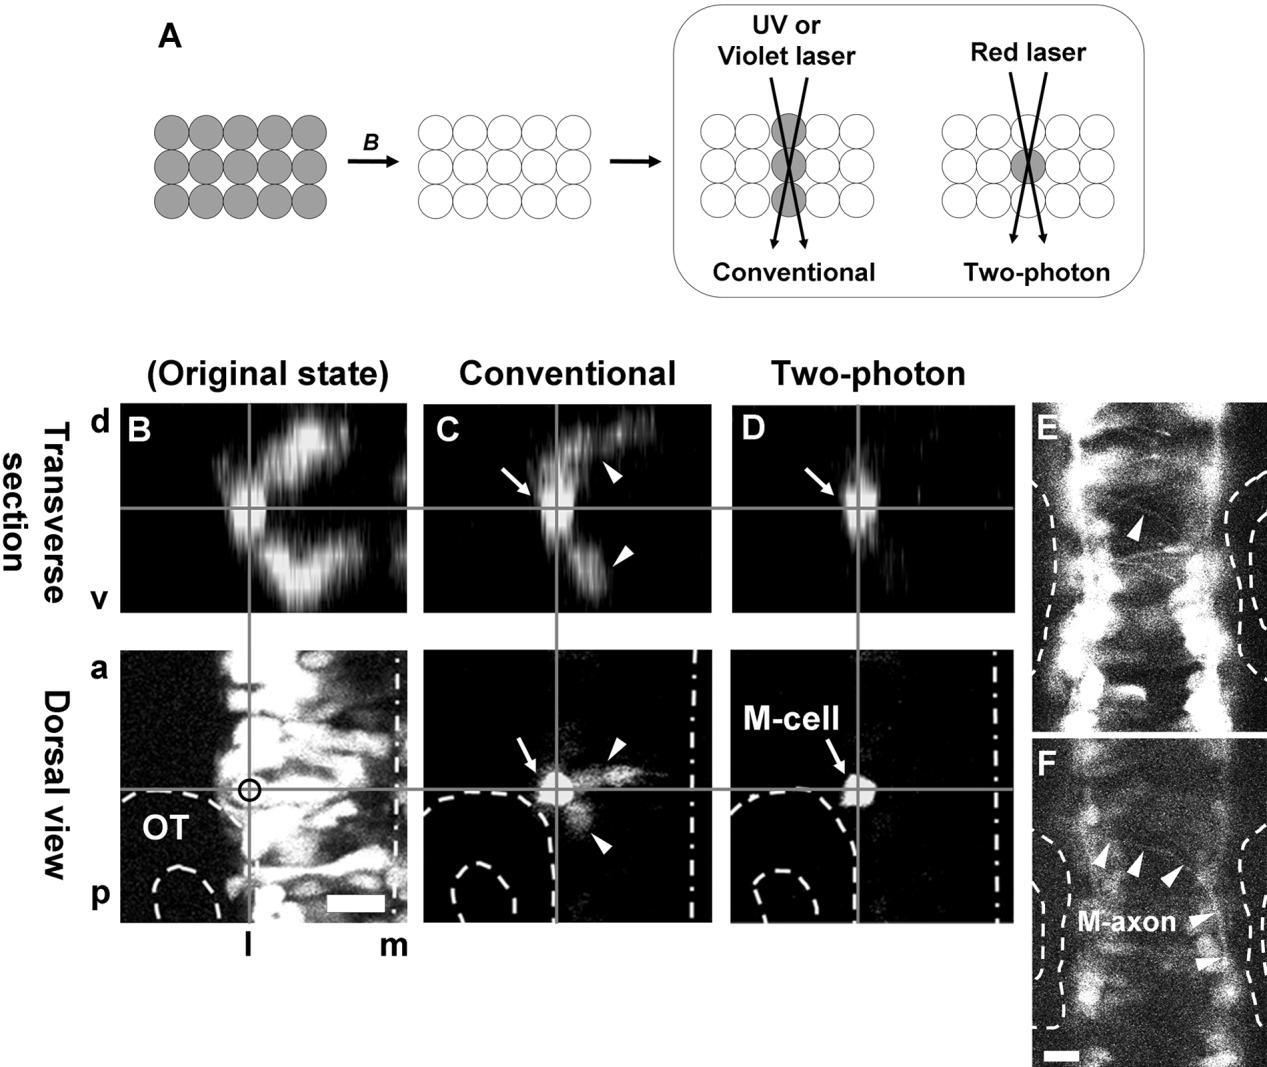
Fig. 5 Labeling of a single neuron located inside of the brain using Dronpa by two-photon confocal microscopy: Visualization of a Mauthner cell. A: Schematic representation of the comparison between the results of photoreactivation of Dronpa in a layered tissue by conventional or two-photon confocal microscopy. The former results in the label as a column, whereas the latter results in the label specifically in the focused cells. All cells initially expressing Dronpa are fluorescent green in color. After scanning with strong blue laser (B), the fluorescence is eliminated. Scanning on the cell of interest with (ultra-) violet laser reactivates the fluorescence, not only in the cell of interest but also in the neighboring cells along the path of the laser. Conversely, by using two-photon confocal microscopy, the cells in focus can be specifically labeled, as red laser cannot reactivate the fluorescence of Dronpa and the two-photon event that is required to reactivate the fluorescence is limited to the focal plane. B: Confocal observation of the hindbrain near the otic vesicle (OT, outlined with broken lines), expressing Dronpa with the 488-nm laser. The embryo is a double-hetero transgenic of Tg(dld:Gal4) and Tg(UAS:dronpa) at around stage 21 hours postfertilization (hpf). Dorsal view (a projection of 14 optical slices taken at the interval of 5.4 μm) is at the bottom, and an optically reconstructed transverse section is on the top. d, dorsal; v, ventral; a, anterior; p, posterior; m, medial; l, lateral. The midline of hindbrain is indicated by long dashed dotted line. C: The same specimen after an attempt at re-highlighting a neuron inside of the brain by conventional confocal microscopy. The specimen was first scanned repeatedly with the strong 488-nm laser to eliminate entire fluorescence in the area, then scanned twice at the center of a chosen neuron with 405 nm by conventional confocal microscope. These scans were made from the dorsal side. The cell was highlighted, but the fluorescence of the dorsally and ventrally neighboring cells along the laser path (arrowheads) were also activated to obtain sufficient brightness at the target cell. D: The same specimen after the successful re-highlighting of a single neuron inside of the brain by two-photon microscopy. It was located at the middle of rhombomere 4 near the anterior edge of the otic vesicle (outlined). After elimination of the fluorescence as described above, specimen was scanned repeatedly (1,000 times) at the center of the chosen neuron with 780 nm by two-photon confocal microscopy from the dorsal side. The cell was highlighted without activating the fluorescence of the dorsally and ventrally neighboring cells along the laser path. E: An optical slice of B at the floor of the hindbrain, with enhanced brightness and contrast, demonstrating numerous axons and growth cones crossing the midline. The axon from the left Mauthner neuron is indicated by arrowhead. F: An optical slice of C at the floor of the hindbrain, demonstrating a single axon crossing the midline (M-axon, arrowheads), gradually turning posteriorly and joining the contralateral medial longitudinal track, confirming that the single cell we labeled was indeed the left Mauthner neuron (M-cell in D). Scale bars = 20 μm.