
|
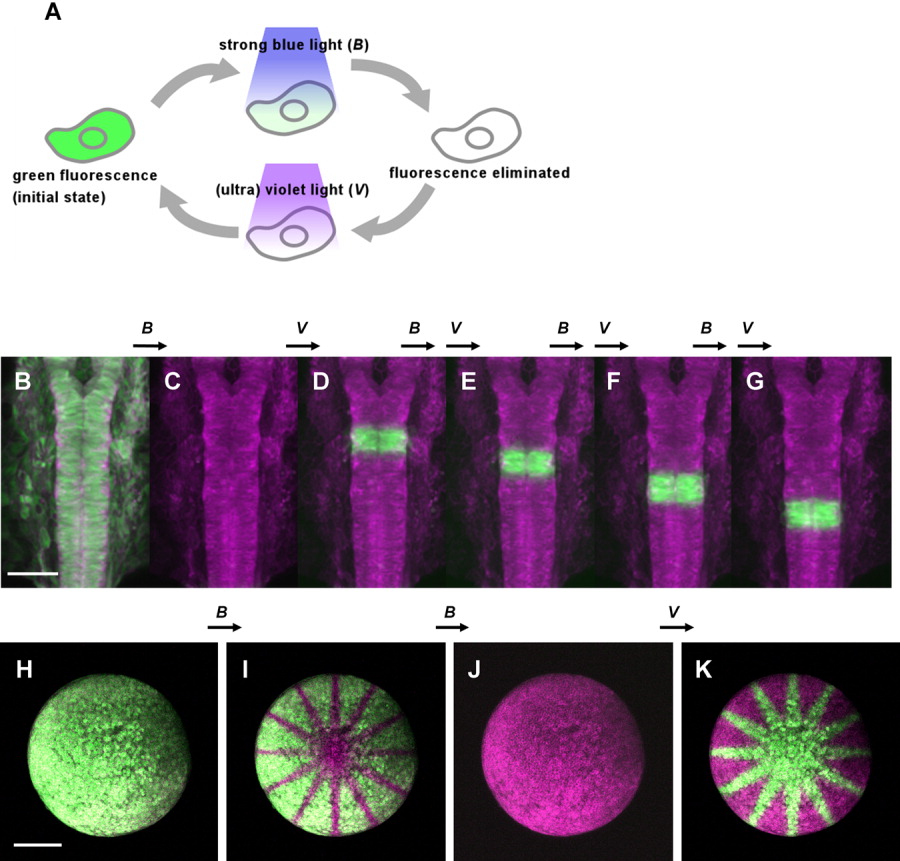
Fig. 1 Repeated elimination and reactivation of Dronpa fluorescence, a reversible green fluorescent protein (GFP), with blue and violet lights, in zebrafish in vivo. A: Schematic diagram explaining the reversible nature of Dronpa fluorescent proteins. After synthesis, Dronpa exhibits green fluorescence. This fluorescence is eliminated after exposure to a strong blue light but is recovered after a brief exposure to a (ultra-) violet light. This process can be repeated. B-G: Highlighting rhombomeres one after another in the same embryo at 19 hours postfertilization (hpf). Anterior is to the top. Dorsal view of the hindbrain of an embryo that expresses Dronpa and membrane-bound monomeric red fluorescent protein (mRFP) after co-injection of the corresponding synthesized RNAs at the single cell stage. Dronpa is a fluorescent green color, and mRFP is a fluorescent red color. All images have been pseudo-colored magenta. B: The embryo is initially doubly fluorescent in green and red. C: Scanning with a strong 488-nm laser eliminated entirely the green fluorescence. D-G: Rhombomere 4 was scanned with the 405-nm laser. This specifically re-highlighted the area in green. By repeating this process, we could highlight rhombomeres 4, 5, 6, and 7 one at a time. Note that the red fluorescence of mRFP is not affected during these procedures. H-K: Imprinting an identical pattern but in reversed color combinations on the same embryo. The embryo was at the stage of 50% epiboly to early gastrula (5-6 hpf). Each of two alternative methods based on either elimination with blue light or reactivation with (ultra-) violet light. I: Twelve radial lines were first imprinted on the embryo expressing Dronpa and mRFP by eliminating the green fluorescence by scanning with a strong 488-nm laser in this pattern. J,K: The embryo was then scanned with the strong 488-nm laser entirely (J), then, with the 405-nm laser in the same pattern of radiation (K). The arrow marked B indicates exposure to the blue light, and V indicates exposure to the (ultra-) violet. See also Supplementary Movies S1a and S1b. Scale bars = 100 μm in B, 200 μm in I.