
- Title
-
Ets1-Related Protein Is a Key Regulator of Vasculogenesis in Zebrafish
- Authors
- Sumanas, S., and Lin, S.
- Source
- Full text @ PLoS Biol.
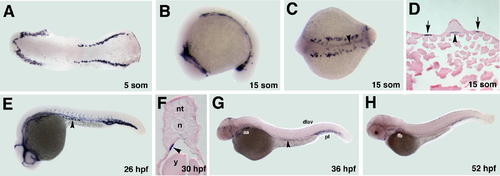
Expression Pattern of etsrp as Analyzed by In Situ Hybridization Anterior is to the left except as noted. (A) five-somite stage. etsrp is expressed within lateral mesoderm in two distinct expression domains, in the anterior and posterior parts of an embryo. (B) 15-somite stage, lateral view. (C) dorsal view. (D) transverse section. etsrp is expressed in two bilateral stripes of presumptive angioblasts within the lateral mesoderm in the anterior and the trunk and posterior parts of an embryo (arrows, D). In addition, a stripe of etsrp-expressing cells is apparent at the midline and extends through the middle and posterior parts of an embryo (arrowhead, C and D). (E) 26 hpf stage. etsrp is expressed in vascular endothelial cells of the axial, head, and intersomitic vessels. Note a group of etsrp-expressing cells bilaterally located in the intermediate mesoderm (arrowhead). (F) Transverse section through the trunk region of a 30 hpf embryo. Arrowhead shows one of the etsrp-expressing cells located within the lateral/intermediate mesoderm. Expression of etsrp in the axial vessels is weak at this stage and not apparent in this section. nt, neural tube; n, notochord; y, yolk. (G) 36 hpf stage. etsrp is expressed in a subset of head vessels, the aortic arches (aa), the cardinal vein plexus (pl) region, posterior intersomitic vessels, and the dorsal longitudinal anastomotic vessel (dlav). Note a group of etsrp-expressing cells located in the endodermal region (arrowhead). (H) 52 hpf stage. etsrp expression is observed in a subset of head vessels, common cardinal vein, pectoral fin bud blood vessels (fb), cardinal vein plexus region, and weakly in posterior intersegmental vessels and the dorsal vessel. EXPRESSION / LABELING:
|
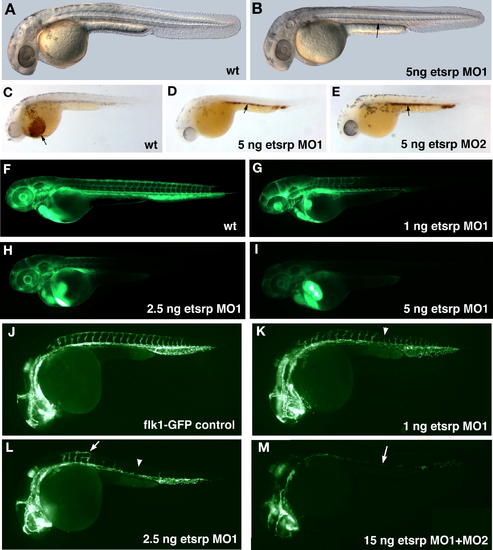
MO Knockdown of Etsrp Protein Function Disrupts Blood Vessel Formation in the Zebrafish Embryos (A,B) Morphological analysis of live etsrp morphants at 34 hpf. (A) Uninjected control embryo. (B) 5 ng of etsrp MO1-injected embryo. Notice that red blood cells are scattered throughout the circulatory system in the control uninjected embryo while they accumulate at their formation site within the intermediate cell mass (arrow, B) in the etsrp morphant. (C–E) o-dianisidine staining of heme in the red blood cells of uninjected control (C), 5 ng of etsrp MO1-injected (D) and 5 ng of etsrp MO2-injected (E) embryos at 34 hpf. While many circulating blood cells are apparent within the common cardinal vein before entering the heart in the control embryo (arrow, C), they stay at their formation site within the ICM region in etsrp morphants (arrows). (F–I) Microangiography analysis of the circulatory system by injecting fluorescein-labeled dextran into the sinus venosus of etsrp morphants at 55 hpf. (F) Control uninjected, (G) 1 ng of etsrp MO1-injected (H) 2.5 ng of etsrp MO1-injected (I) 5 ng of etsrp MO1-injected embryos. Note that the embryo in (G) has lost circulation in the posterior vessels, the embryo in (H) has lost circulation in most vessels, and the embryo in (I) has no circulation at all. (J–M) Analysis of blood vessels in live flk1-GFP transgenic embryos at 26 hpf. (J) Control uninjected, (K) 1 ng of etsrp MO1-injected, (L) 2.5 ng of etsrp MO1-injected, (M) 15 ng of etsrp MO1+MO2 (1:1) mix-injected embryos. Note the gaps in formation of intersegmental vessels in (K) (arrowhead), the missing (arrowhead) and abnormally branched, (arrow) intersegmental vessels in (L), and the nearly completely eliminated flk1 expression from axial vessels (arrow) in (M). |
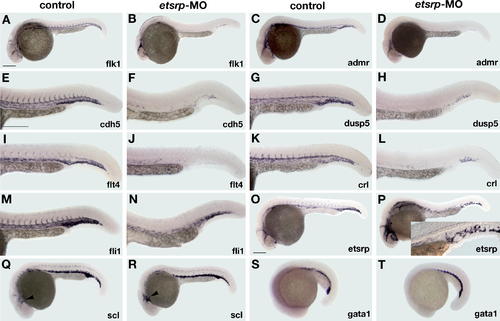
Molecular Analysis of Vascular Endothelial and Hematopoietic Markers in etsrp Morphants (A, C, E, G, I, K, M, O, Q, S) Uninjected control embryo; (D, H, J, L, P, R, T) 8 ng etsrp MO2-injected embryo; (B, F, N) 12 ng etsrp MO1+MO2 (1:1) mix-injected embryos for the maximum knockdown. All embryos are at 24 hpf, except as noted. Scale bar, 0.2 mm. (A,B) flk1 expression; (C,D) admr expression; (E,F) cdh5 expression; (G,H) dusp5 expression; (I,J) flt4 expression; (K,L) crl expression. Note that the vascular expression of the markers in (A–L) is almost absent in etsrp morphants. (M,N) fli1 expression; (O,P) etsrp expression. Note the more intense etsrp expression and reduced fli1 expression in angioblasts which remain dispersed and fail to coalesce into blood vessels in etsrp morphants. Inset, (P) DIC image of scattered angioblasts in etsrp morphants. (Q,R) scl expression, 22 hpf. Note that scl expression appears unaffected at this stage except for more intense staining in a subset of head vessels in etsrp morphants (arrowhead). (S,T) gata1 expression, 22 somites. Note that no significant difference in hematopoietic gata1 expression is observed between the control embryos and etsrp morphants. EXPRESSION / LABELING:
|
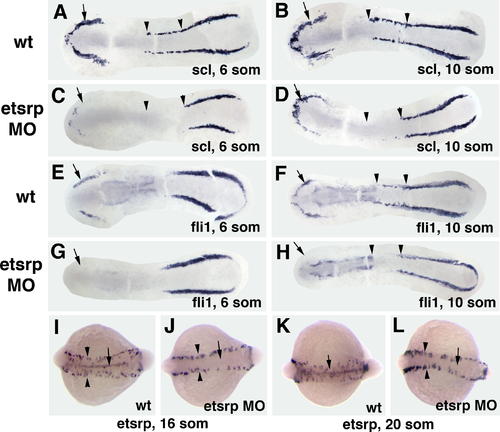
Molecular Analysis of Early Vasculogenesis in etsrp Morphants (A, B, E, F, I, K) Uninjected control embryo; (C, D, G, H, J, L) 8–10 ng etsrp MO2-injected embryo. Anterior is to the left in all panels. (A–H) Embryos were flat mounted with their yolk removed. (A–D) scl expression; six-somite (A,C) and ten-somite (B,D) stages. Note that the anterior domain of scl expression (arrows) is reduced and the trunk domain (arrowheads) is missing in etsrp morphants. (E–H) fli1 expression; six-somite (E,G) and ten-somite (F,H) stages. Note that the anterior domain of fli1 expression (arrows) is missing in the etsrp morphants, while the posterior domain is not affected. Also note that the trunk domain of fli1 expression (arrowheads, F,H) is missing at the ten-somite stage in etsrp morphants. (I–L) etsrp knockdown blocks angioblast migration towards the midline as assayed by etsrp expression at the 16-somite (I,J) and 20-somite (K,L) stages. (I,K) Uninjected control embryo; (J,L) 7.5 ng etsrp MO2-injected embryo. Dorsal view, anterior is to the left. Note that the midline stripe of angioblasts (arrows) is missing in etsrp morphants. Also notice more intense etsrp expression in pre-migratory angioblasts (arrowheads) in etsrp morphants as compared to control embryos. EXPRESSION / LABELING:
|
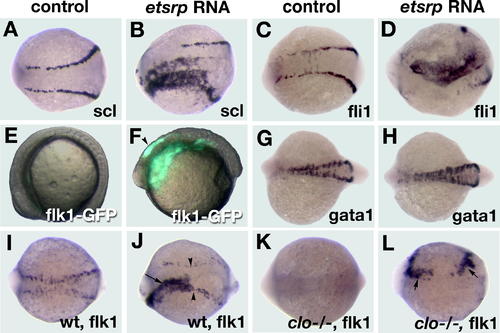
etsrp RNA Overexpression Induces Ectopic Expression of Vascular Endothelial Markers Dorsal view, anterior to the left in all panels except for (E,F) which are lateral views. (A, C, E, and G) Control uninjected embryo; (B, D, F, and H) 100 pg of etsrp RNA-injected embryo. (A,B) scl expression at the eight-somite stage; (C,D) flk1 expression at the nine-somite stage. Note the strong ectopic induction of scl and fli1 upon overexpression of etsrp RNA. (E,F) Live flk1-GFP embryo at the 14-somite stage; fluorescent and transmitted light images were overlayed. Note the very strong ectopic induction of GFP expression in different tissues including neuroectoderm (arrow, F) upon etsrp RNA overexpression. Fluorescence in the control uninjected flk1-GFP embryo in (E) is not detectable under the same exposure. (G,H) gata1 expression at the 16-somite stage. Note that gata1 expression is not affected upon etsrp overexpression. (I–L) etsrp RNA induces flk1 expression in clo mutant embryos as analyzed using flk1 probe at the ten- to 12-somite stages. (I) wt (or clo+/-) embryo, (J) wt (or clo+/-) embryo injected with 100 pg of etsrp RNA, (K) clo-/- embryo, (L) clo-/- embryo injected with 100 pg of etsrp RNA. Note that in a clo+/- (or wt) embryo etsrp RNA induces ectopic flk1 (arrow, J) in addition to the endogenous flk1 expression (arrowheads, J) while clo-/- etsrp RNA-injected embryo shows only ectopic flk1 (arrows, L). EXPRESSION / LABELING:
|
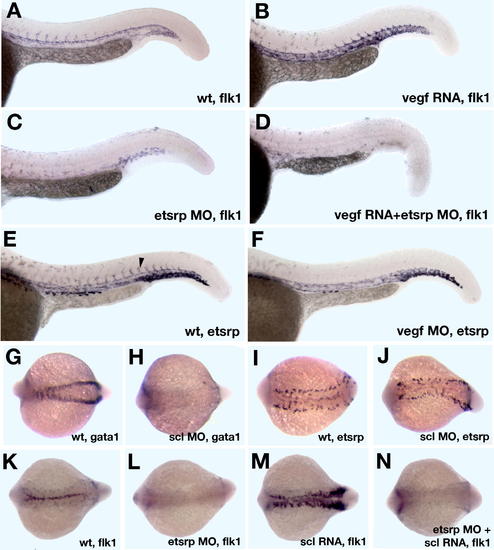
etsrp Is Required for vegf and scl Signaling (A–D) Etsrp is required for Vegf signaling as assayed for flk1 expression at 26 hpf. (A) Control uninjected embryo, (B) vegf RNA-injected embryo, (C) 7.5 ng of etsrp MO2-injected embryo, (D) vegf RNA- and etsrp MO2-co-injected embryo. Note that vegf RNA induces strong flk1 expression in (B) while vegf RNA and etsrp MO co-injection results in loss of flk1 expression in (D), similar to the etsrp morphant phenotype in (C). (E,F) Etsrp expression analysis in Vegf morphants at 26 hpf. (E) Control uninjected embryo; (F) 10.5 ng of vegf MO-injected embryo. Note that vegf morphants have lost etsrp expression in the intersegmental vessels (arrowhead, E). (G–J) Scl knockdown affects gata1 but not etsrp expression at the 15-somite stage. Dorsal view, anterior is to the left. (G,I) Control uninjected embryo; (H,J) 10 ng scl UTR-MO-injected embryo. (G,H) gata1 expression; (I,J) etsrp expression. (K–N) Etsrp is required for scl signaling in clo mutants as analyzed for flk1 expression at the 15-somite stage. (K) Control uninjected embryo; (L) 7.5 ng etsrp MO2-injected embryo; (M) scl RNA-injected embryo; (N) scl RNA- and etsrp MO2-co-injected embryo. Note that scl RNA causes ectopic flk1 expression in (M) which is lost upon knockdown of Etsrp in (N). EXPRESSION / LABELING:
|

Unillustrated author statements |