
Figure 2
|
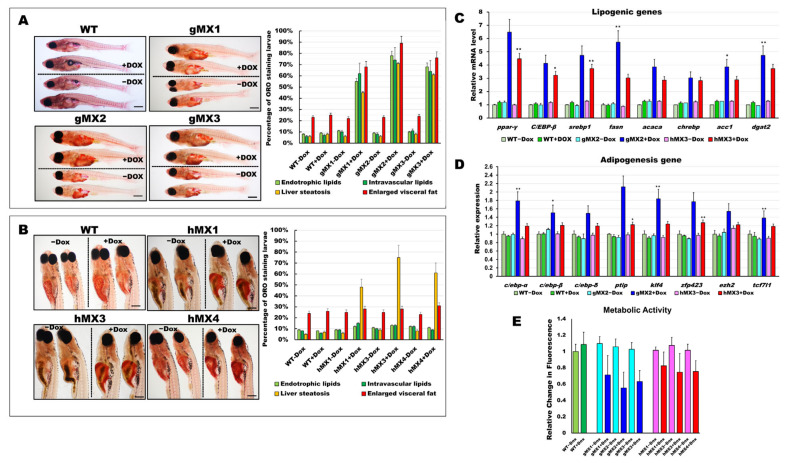
Figure 2 Characterization of early onset of adipogenesis and energy balance in gMXs and hMXs larvae. (A) Left: whole-mount ORO staining of WT ± Dox and gMXs (1–3) ± Dox larvae at 24 dpf. Scale bar: 100 μm. Right: the percentage of ORO-stained zebrafish larvae. (B) Left: whole-mount ORO staining of WT ± Dox and hMXs (1, 3, and 4) ± Dox larvae at 24 dpf. Scale bar: 125 μm. Right: the percentage of ORO-stained zebrafish larvae. (C) Molecular analysis of gMX2 and hM3 larvae revealed the upregulation of lipogenic genes, ppar-γ, C/EBP-β, srebp1, fasn, acaca, chrebp, acc1, and dgat2. (D) Molecular analysis of gMX2 and hM3 larvae revealed an upregulation of adipogenesis genes, c/ebp-α, c/ebp-β, c/ebp-δ, ptip, klf4, zfp423, ezh2, and tcf7l1. (E) Response to gMX2 and hM3 larvae by the Alamar Blue assay. Data are conveyed as the relative difference in signal intensity in three discrete assays (mean ± SEM, n = 40), Statistically significant differences from the controls are indicated by * (p < 0.05), and ** (p < 0.01).