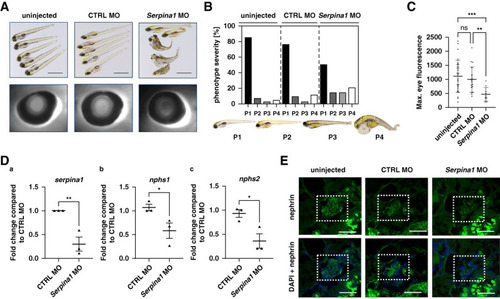
Knockdown of Serpina1 in zebrafish causes edema, proteinuria, and loss of podocyte marker expression. (A) Representative zebrafish phenotype pictures (upper panel) and eyes of transgenic Tg(l-fabp:VDBP:eGFP) zebrafish larvae in uninjected condition and after injection of a CTRL MO or a Serpina1 morpholino at one to four cell stages. Pictures were taken at 120 hpf. Scale bar 500 µm. (B) Quantification of edema phenotype of 120 hpf zebrafish larvae shown in (A). Phenotypes corresponding to P1, P2, P3, and P4 are shown below. (C) Maximal fluorescence detected in the retinal plexus (max. eye fluorescence) of transgenic Tg(l-fabp:VDBP:eGFP) zebrafish larvae in uninjected condition or after CTRL MO or Serpina1 MO injection. Shown is mean±SD. (D) mRNA expression of Serpina1 (a), nphs1 (b), and nphs2 (c) in whole zebrafish lysates. Expression is given as fold change compared with CTRL MO. Shown are mean±SD, *P < 0.05, **P < 0.01, ***P < 0.001 n=3. (E) Immunofluorescent staining for nephrin (green) on zebrafish sections. DAPI staining is shown in blue. White boxes highlight glomerular region. Scale bar 50 µm. hpf, hours post fertilization; MO, morpholino.
|
