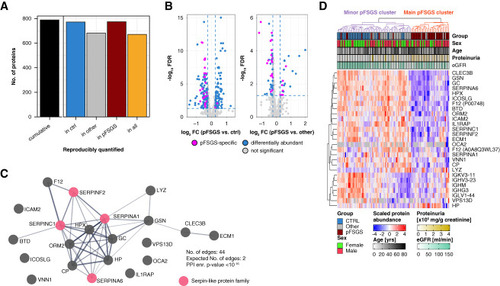
Identification of pFSGS patient-specific serum proteome profiles. (A) Bar chart representing the number of cumulatively identified proteins (left panel) and reproducibly quantified proteins (right panel). To be assigned as reproducibly quantified in the three disease groups proteins need to possess at least three quantitative observations within the corresponding group. To be considered as reproducibly quantified in all three disease groups proteins need to possess at least three quantitative observations in each group. (B) Volcano plots representing the abundance differences (x axis, log2 fold change) and significance values (y axis, log10 FDR) for the pairwise comparisons pFSGS versus healthy controls (left panel) and pFSGS versus other renal disease (right panel). Blue dots represent proteins assigned as significant in the given pairwise comparison, whereas magenta dots represent pFSGS-specific proteins identified from ANOVA with post hoc testing. (C) PPI from 27 pFSGS-specific proteins. Nodes represent proteins, whereas edges represent known functional and/or physical interactions. Created with StringDB.18 (D) Heatmap representing the scaled protein abundances (color scale) of all 27 pFSGS-specific proteins (rows) in all 103 included patients (columns). Top annotations indicate patients' disease group assignment as well as clinical parameters sex, age, proteinuria, and eGFR. BTD, benzothiadiazole; CLEC3B, c-type lectin domain family 3 member b (tetranectin); CTRL, healthy controls; ECM, extracellular matrix; F12, factor 12; FC, fold change; FDR, false discovery rate; HPX, hemopexin; ICOSL, inducible costimulator ligand; pFSGS, primary FSGS; Other, other renal disease; PPI, protein/protein-interaction; SERPIN, serpin-like protein family.
|
