|
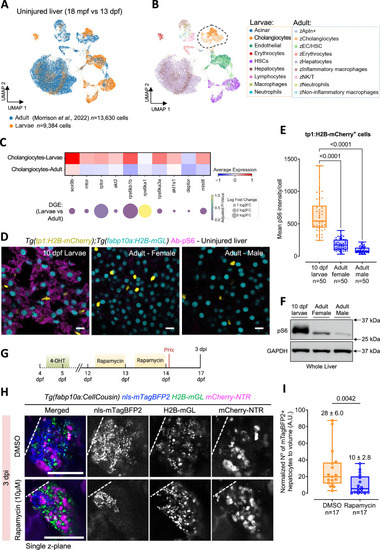
mTORC1 activity in uninjured liver regulates cholangiocyte plasticity during liver regeneration. A UMAP visualization showing the integration of uninjured zebrafish larval and adult liver cells. B Unsupervised clustering of cell types presents in larval and adult datasets. The dashed area indicates cholangiocytes present in the two datasets. C Heatmap of mTORC1 signaling pathway-related gene expression in larval and adult cholangiocytes (top). Fold changes and p-values from differential gene expression (DGE) analysis displayed in dot plot (bottom). D Immunostaining for pS6 in uninjured larval and adult zebrafish liver sections. Scale bars: 10 μm. E Min-to-max boxplot showing quantification of pS6 intensity in cholangiocytes from livers of uninjured larval and adult zebrafish (n = 50 cells from 10 animals) (ANOVA followed by Kruskal Wallis test). F Western blot against pS6 and GAPDH for whole livers from 10 dpf larvae and adult zebrafish. G Schematic of the experimental approach for inhibiting the mTORC1 signaling pathway in Tg(fabp10a:CellCousin) zebrafish larvae. H Confocal images of the liver from 3 dpi Tg(fabp10a:CellCousin) larvae treated with DMSO or 10 μM Rapamycin. Dashed line marks the border of the regenerate. Scale bars: 200 μm. I Min-to-max boxplot showing quantification of normalized mTagBFP2+ de novo hepatocytes following treatment with Rapamycin treatment (n = 17 animals) compared to DMSO controls (n = 17 animals). Each dot represents one animal; mean ± SEM is indicated above each box. Statistical significance was assessed using the Two-tailed Mann–Whitney test.
|