IMAGE

Fig. 7

ID
ZDB-IMAGE-250609-83
Source
Figures for Eski et al., 2025
Image
Figure Caption

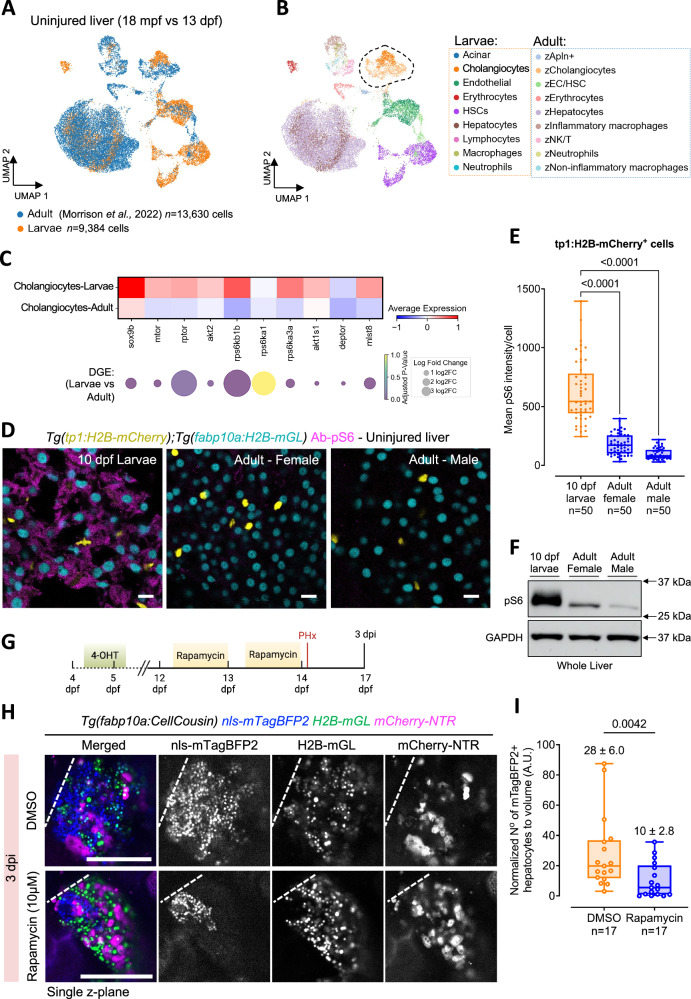
Fig. 7 mTORC1 activity in uninjured liver regulates cholangiocyte plasticity during liver regeneration.

A UMAP visualization showing the integration of uninjured zebrafish larval and adult liver cells. B Unsupervised clustering of cell types presents in larval and adult datasets. The dashed area indicates cholangiocytes present in the two datasets. C Heatmap of mTORC1 signaling pathway-related gene expression in larval and adult cholangiocytes (top). Fold changes and p-values from differential gene expression (DGE) analysis displayed in dot plot (bottom). D Immunostaining for pS6 in uninjured larval and adult zebrafish liver sections. Scale bars: 10 μm. E Min-to-max boxplot showing quantification of pS6 intensity in cholangiocytes from livers of uninjured larval and adult zebrafish (n = 50 cells from 10 animals) (ANOVA followed by Kruskal Wallis test). F Western blot against pS6 and GAPDH for whole livers from 10 dpf larvae and adult zebrafish. G Schematic of the experimental approach for inhibiting the mTORC1 signaling pathway in Tg(fabp10a:CellCousin) zebrafish larvae. H Confocal images of the liver from 3 dpi Tg(fabp10a:CellCousin) larvae treated with DMSO or 10 μM Rapamycin. Dashed line marks the border of the regenerate. Scale bars: 200 μm. I Min-to-max boxplot showing quantification of normalized mTagBFP2+ de novo hepatocytes following treatment with Rapamycin treatment (n = 17 animals) compared to DMSO controls (n = 17 animals). Each dot represents one animal; mean ± SEM is indicated above each box. Statistical significance was assessed using the Two-tailed Mann–Whitney test.

Acknowledgments
This image is the copyrighted work of the attributed author or publisher, and ZFIN has permission only to display this image to its users. Additional permissions should be obtained from the applicable author or publisher of the image. Full text @ Nat. Commun.