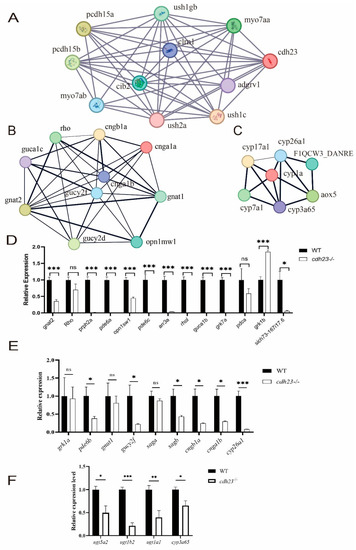
Visualization of network construction analysis of specific pathways. (A) PPI network representing cdh23 gene shows proteins as nodes in graph, with their interactions depicted by lines connecting them. Various colored lines indicate different types of interactions, with thicker lines representing stronger interactions. (B,C) Key genes involved in optical conduction and retinol metabolism, as well as their interactions. (D,E) Gene expression analysis of light sensor degeneration-related genes using RT-qPCR. Additionally, statistical significance was determined with * representing a p value of <0.05, ** representing a p value of <0.01, and *** representing a p value of <0.001. (F) RT-qPCR expression analysis of genes related to retinol metabolism pathway was conducted. The results showed significant differences in gene expression levels (*: p value < 0.05; **: p value < 0.01; ***: p value < 0.001), indicating potential regulatory roles of these pathways in studied biological processes. ns: not significant.
|
