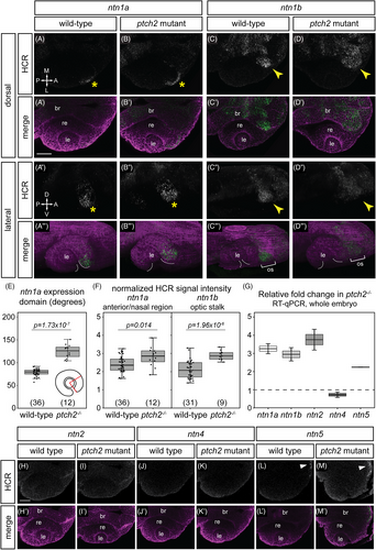
Responsiveness of netrin ligand expression to Hedgehog signaling. (A–D"') HCR RNA-FISH for ntn1a and ntn1b in wild-type embryos (A–A"', C–C''') and ptch2−/− embryos (B–B"', D–D"') at 24 hpf. Dorsal view (A–D, A'–D') and lateral views of 3D renderings (A"–D", A"'–D"'). The merged images (A'–D', A"'–D"') are HCR signal (green) and Tg(bactin2:EGFP-CAAX) transgene (magenta) to visualize tissue morphology. Yellow asterisks (A, A", B, B") indicate ntn1a signal in the nasal margin of the optic fissure, and yellow arrowheads (C, D) indicate ntn1b signal in the optic stalk. White dotted lines demarcate optic fissure margins. (E, F) Quantification of HCR data, for (E) the extent of the ntn1a expression domain; and (F) normalized fluorescence intensity for ntn1a in the optic fissure and ntn1b in the optic stalk. (G) RT-qPCR quantification showing relative fold change of netrin genes in ptch2−/− embryos compared to wild-type embryos at 24 hpf using the ΔΔCt method, where the relative quantity of each gene was normalized to the reference gene eef1a1l1. (H–M') HCR RNA-FISH for ntn2, ntn4, and ntn5 in wild-type (H–H', J–J', L–L') or ptch2 mutant (I–I', K–K', M–M'). White arrowhead (L, M) indicates ntn5 in the telencephalon. The low or undetectable expression in the eye region is similar between wild-type and ptch2 mutant. br, brain; le, lens; re, retina; os, optic stalk. Scale bar, 50 μm.
|
