
- Title
-
Increased Netrin downstream of overactive Hedgehog signaling disrupts optic fissure formation
- Authors
- Lusk, S., LaPotin, S., Presnell, J.S., Kwan, K.M.
- Source
- Full text @ Dev. Dyn.
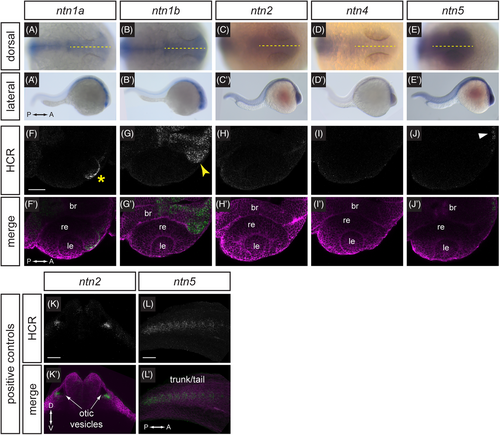
Expression patterns of netrin ligands. (A–E') Whole-mount in situ hybridization for ntn1a, ntn1b, ntn2, ntn4, and ntn5 in wild-type embryos at 24 hpf, (A–E) dorsal orientation, (A'–E') lateral orientation. Yellow dotted lines (A–E) indicate embryo midline. (F–J') HCR RNA-FISH for ntn1a, ntn1b, ntn2, ntn4, and ntn5 in wild-type embryos harboring the Tg(bactin2:EGFP-CAAX) transgene at 24 hpf. (F-J) HCR signal alone. (F'–J') Merge of HCR (green) and Tg(bactin2:EGFP-CAAX) transgene (magenta) to visualize tissue morphology. Yellow asterisk (F) indicates ntn1a signal in the nasal margin of the optic fissure; yellow arrowhead (G) indicates ntn1b signal in the optic stalk; white arrowhead (J) indicates faint ntn5 in the telencephalon. (K-L') HCR RNA-FISH positive controls for ntn2 and ntn5 in wild-type embryos harboring the Tg(bactin2:EGFP-CAAX) transgene at 24 hpf. (K, K') ntn2 expression in otic vesicles. (L, L') ntn5 expression in the trunk and tail. (K-L) HCR signal alone. (K', L') Merge of HCR (green) and Tg(bactin2:EGFP-CAAX) transgene (magenta) to visualize tissue morphology. br, brain; le, lens; re, retina. Scale bar, 50 μm. EXPRESSION / LABELING:
|
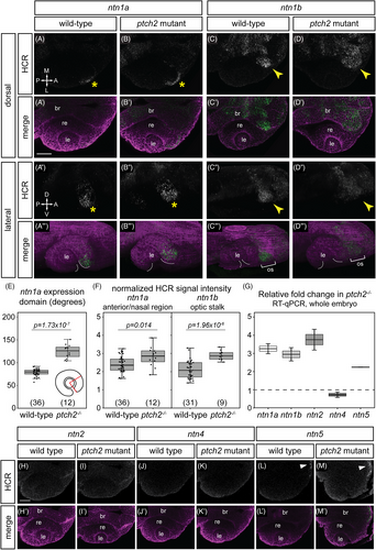
Responsiveness of netrin ligand expression to Hedgehog signaling. (A–D"') HCR RNA-FISH for ntn1a and ntn1b in wild-type embryos (A–A"', C–C''') and ptch2−/− embryos (B–B"', D–D"') at 24 hpf. Dorsal view (A–D, A'–D') and lateral views of 3D renderings (A"–D", A"'–D"'). The merged images (A'–D', A"'–D"') are HCR signal (green) and Tg(bactin2:EGFP-CAAX) transgene (magenta) to visualize tissue morphology. Yellow asterisks (A, A", B, B") indicate ntn1a signal in the nasal margin of the optic fissure, and yellow arrowheads (C, D) indicate ntn1b signal in the optic stalk. White dotted lines demarcate optic fissure margins. (E, F) Quantification of HCR data, for (E) the extent of the ntn1a expression domain; and (F) normalized fluorescence intensity for ntn1a in the optic fissure and ntn1b in the optic stalk. (G) RT-qPCR quantification showing relative fold change of netrin genes in ptch2−/− embryos compared to wild-type embryos at 24 hpf using the ΔΔCt method, where the relative quantity of each gene was normalized to the reference gene eef1a1l1. (H–M') HCR RNA-FISH for ntn2, ntn4, and ntn5 in wild-type (H–H', J–J', L–L') or ptch2 mutant (I–I', K–K', M–M'). White arrowhead (L, M) indicates ntn5 in the telencephalon. The low or undetectable expression in the eye region is similar between wild-type and ptch2 mutant. br, brain; le, lens; re, retina; os, optic stalk. Scale bar, 50 μm. |
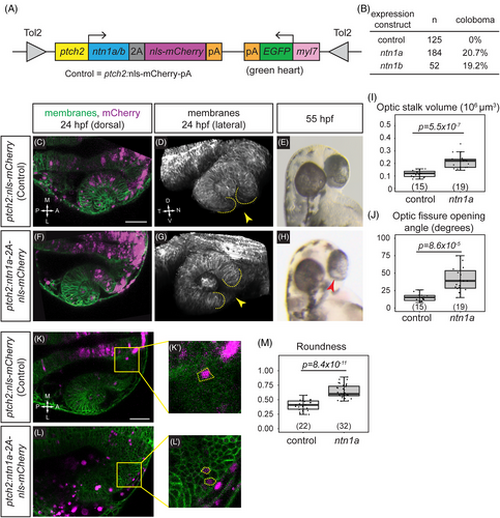
netrin overexpression is sufficient to disrupt cause coloboma, disrupt optic fissure formation, and perturb optic stalk cell morphology. (A) Schematic illustrating transient transgenesis expression construct (GBS-ptch2:ntn1a[or ntn1b]-2A-nls-mCherry). The control construct drives expression of only nls-mCherry. (B) Quantification of coloboma in wild-type embryos injected with the control construct, the ntn1a, or ntn1b overexpression construct. Transient transgenic overexpression of ntn1a or ntn1b is sufficient to cause coloboma in 20.7% or 19.2% of wild-type embryos, respectively. (C–M) Analysis of optic fissure formation and optic stalk cell morphology. (C–E) Wild-type embryo injected with control (nls-mCherry) transgene expression construct. (F–H) Wild-type embryo injected with the ntn1a overexpression transgene expression construct. (C, F) Single optical sections, dorsal view, 24 hpf. Green, membranes (Tg[bactin2:EGFPCAAX]); magenta, nuclei (nls-mCherry from the transgene expression construct). (D, G) Lateral views of 3D renderings show optic fissure margins (dotted lines) and opening (yellow arrowhead), 24 hpf. Grayscale, membranes only. (E, H) Optic fissure phenotypes at 55 hpf. The control embryo optic fissure is largely fused (E); (H) shows a representative ntn1a-overexpressing embryo with coloboma (red arrowhead indicates open, unfused fissure). (I–J) Quantification of optic stalk volume (I) and optic fissure opening angle (J), both of which are significantly increased in ntn1a-overexpressing embryos. (K–M) Analysis of optic stalk cell morphology, 24 hpf, dorsal view, single optical section. (K, K') Wild-type embryo injected with control (nls-mCherry) transgene expression construct. (L, L') Wild-type embryo injected with experimental (ntn1a overexpression) transgene expression construct. Green, membranes (Tg[bactin2:EGFPCAAX]); magenta, nls-mCherry from the transgene expression construct. (K', L') Zoomed views of individual transgene-expressing cells in the optic stalk, as marked by nls-mCherry fluorescence. Dotted lines show cell morphology, as visualized with (Tg[bactin2:EGFPCAAX]). (M) Quantification of cell elongation using the Roundness metric; netrin1a-overexpressing optic stalk cells are significantly less elongated than their control counterparts. Numbers in parentheses at base of graphs indicate n. Scale bar, 50 μm. |
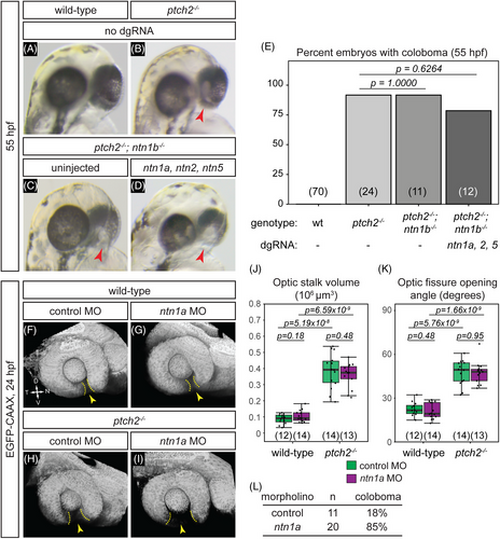
Netrin ligands are not required for the ptch2−/− coloboma phenotype. (A-E) Loss of netrin genes using CRISPR mutagenesis does not rescue the ptch2−/− coloboma phenotype. All embryos were evaluated for coloboma, genotyped, and gRNA-injected embryos were then individually quantified for mutagenesis efficiency. For gRNA-injected embryos, only ptch2 −/−;ntn1b−/− embryos with >70% alleles mutated for the remaining three genes were analyzed. (A) wild-type (wt), (B) ptch2−/−, (C) ptch2−/−; ntn1b−/−, (D) ptch2−/−; ntn1b−/− injected with ntn1a, ntn2, and ntn5 dgRNA, 55 hpf. Red arrowheads, coloboma. (E) Percentage of embryos with coloboma. Numbers in parentheses at base of graph indicate n. (–L) Morpholino-mediated knockdown of ntn1a does not rescue the ptch2−/− optic fissure and stalk phenotypes. (F) wild-type injected with control MO; (G) wild-type injected with ntn1a MO; (H) ptch2−/− injected with control MO; (I) ptch2−/− injected with ntn1a MO. Tissue morphology visualized with Tg(bactin2:EGFP-CAAX) transgene (grayscale), 24 hpf. Yellow dotted lines, optic fissure margins; yellow arrowheads, optic fissure opening. (J, K) Quantification of optic stalk volume (J) and optic fissure opening angle (K) at 24 hpf, neither of which is affected by ntn1a MO injection. (L) Quantification of coloboma in embryos from ptch2+/−; Tg(bactin2:EGFP-CAAX) incross injected with the control MO, or the ntn1a MO. Knockdown of ntn1a in the ptch2−/− results in a coloboma phenotype in 85% of embryos. n = total number of embryos screened. |