
Fig. 3
- ID
- ZDB-FIG-250313-56
- Publication
- Lusk et al., 2024 - Increased Netrin downstream of overactive Hedgehog signaling disrupts optic fissure formation
- Other Figures
- All Figure Page
- Back to All Figure Page
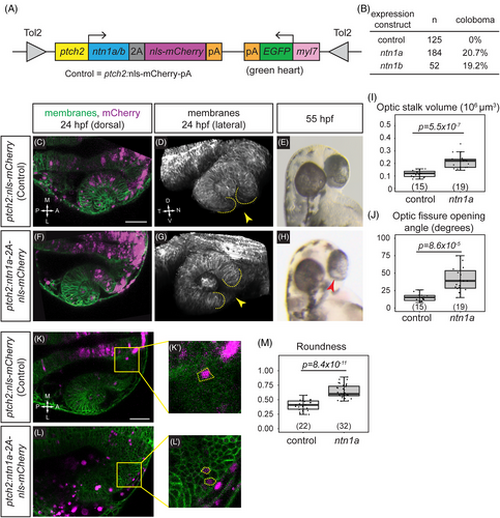
netrin overexpression is sufficient to disrupt cause coloboma, disrupt optic fissure formation, and perturb optic stalk cell morphology. (A) Schematic illustrating transient transgenesis expression construct (GBS-ptch2:ntn1a[or ntn1b]-2A-nls-mCherry). The control construct drives expression of only nls-mCherry. (B) Quantification of coloboma in wild-type embryos injected with the control construct, the ntn1a, or ntn1b overexpression construct. Transient transgenic overexpression of ntn1a or ntn1b is sufficient to cause coloboma in 20.7% or 19.2% of wild-type embryos, respectively. (C–M) Analysis of optic fissure formation and optic stalk cell morphology. (C–E) Wild-type embryo injected with control (nls-mCherry) transgene expression construct. (F–H) Wild-type embryo injected with the ntn1a overexpression transgene expression construct. (C, F) Single optical sections, dorsal view, 24 hpf. Green, membranes (Tg[bactin2:EGFPCAAX]); magenta, nuclei (nls-mCherry from the transgene expression construct). (D, G) Lateral views of 3D renderings show optic fissure margins (dotted lines) and opening (yellow arrowhead), 24 hpf. Grayscale, membranes only. (E, H) Optic fissure phenotypes at 55 hpf. The control embryo optic fissure is largely fused (E); (H) shows a representative ntn1a-overexpressing embryo with coloboma (red arrowhead indicates open, unfused fissure). (I–J) Quantification of optic stalk volume (I) and optic fissure opening angle (J), both of which are significantly increased in ntn1a-overexpressing embryos. (K–M) Analysis of optic stalk cell morphology, 24 hpf, dorsal view, single optical section. (K, K') Wild-type embryo injected with control (nls-mCherry) transgene expression construct. (L, L') Wild-type embryo injected with experimental (ntn1a overexpression) transgene expression construct. Green, membranes (Tg[bactin2:EGFPCAAX]); magenta, nls-mCherry from the transgene expression construct. (K', L') Zoomed views of individual transgene-expressing cells in the optic stalk, as marked by nls-mCherry fluorescence. Dotted lines show cell morphology, as visualized with (Tg[bactin2:EGFPCAAX]). (M) Quantification of cell elongation using the Roundness metric; netrin1a-overexpressing optic stalk cells are significantly less elongated than their control counterparts. Numbers in parentheses at base of graphs indicate n. Scale bar, 50 μm. |