
Fig. 4
- ID
- ZDB-FIG-250219-4
- Publication
- Bouwman et al., 2025 - Cross-species comparison reveals that Hmga1 reduces H3K27me3 levels to promote cardiomyocyte proliferation and cardiac regeneration
- Other Figures
- All Figure Page
- Back to All Figure Page
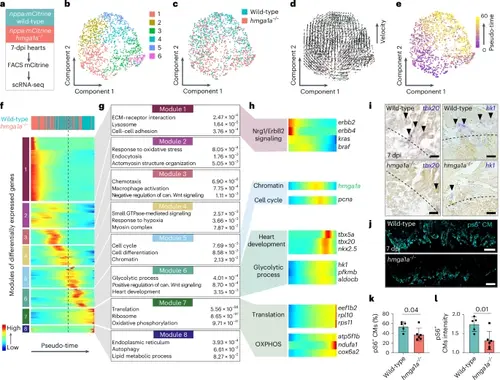
Hmga1a regulates progression of the regeneration program in BZ CMs. a, scRNA-seq workflow on nppa:mCitrine+ cells from 7-dpi wild-type (n = 12) and hmga1a−/− (n = 12) hearts. b, UMAP representation of scRNA-seq data after unsupervised clustering by Seurat. c, Distribution of wild-type and hmga1a−/− cells over UMAP. d, RNA velocity plotted on UMAP. Arrows are vectors that indicate the present and future position of a cell in the UMAP based on the ratio of spliced and unspliced reads. e, Pseudo-temporal ordering of cells performed using Monocle 2 represented on UMAP. Scale from 0 to 60 (purple-yellow). f, Self-organizing heatmap of gene modules co-expressed over pseudo-time. Each line represents a single gene. Cells ordered based on pseudo-time are divided in 100 bins. Legend on the top shows the predominant genotype present in each bin. Dashed line indicates the beginning of module 5, containing hmga1a. g, Three representative GO terms and their P value (obtained using DAVID online GO analysis tool) are shown for genes in modules 1–8 of f. can., canonical. h, Heatmaps over pseudo-time of individual genes of interest from modules 1, 5, 6 and 7. Linked biological processes are indicated on the left of the heatmaps; gene names are indicated on the right. i, Representative images from ISH against tbx20 (left) and hk1 (right) showing part of the BZ of wild-type and hmga1a−/− hearts at 7 dpi. n = 3 hearts were analyzed per condition. Dashed line indicates the injury border. Arrowheads indicate tbx20/hk1-expressing CMs. Scale bars, 50 μm. j, Representative images from immunofluorescent staining showing myocardial pS6 in the BZ of wild-type and hmga1a−/− zebrafish hearts at 7 dpi. Scale bars, 100 μm. k,l, Quantification of myocardial pS6 signal in wild-type (n = 5) versus hmga1a−/− (n = 6) 7-dpi BZ. Datapoints represent individual hearts. Error bars indicate mean ± s.d. Statistics were performed by two-tailed unpaired t-test and show a significant difference in percentage of pS6+ area relative to tropomyosin+ area (k) (P = 0.04) and in intensity of pS6 signal relative to tropomyosin signal (l) (P = 0.01). |