
Fig. 3
- ID
- ZDB-FIG-250219-3
- Publication
- Bouwman et al., 2025 - Cross-species comparison reveals that Hmga1 reduces H3K27me3 levels to promote cardiomyocyte proliferation and cardiac regeneration
- Other Figures
- All Figure Page
- Back to All Figure Page
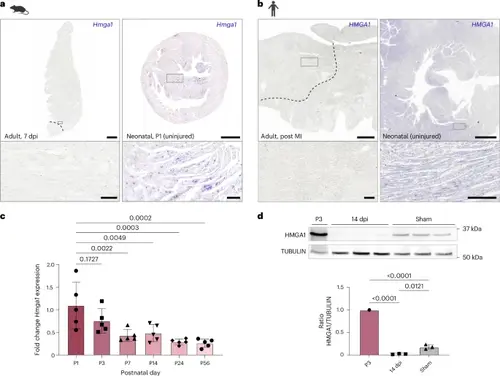
Hmga1 correlates with regenerative capacity of the mammalian heart. a, Representative ISH for Hmga1 in left ventricular tissue of injured adult mouse hearts (left panel) and in uninjured neonatal P1 mouse hearts (right panel). n = 3 hearts were analyzed per condition. Scale bars, 0.5 mm in the overview and 50 μm in the zoom-ins. Dashed line in the left panel indicates the injury border. b, Representative ISH images of HMGA1 expression in intraventricular septum tissue of an injured adult human heart (left panel) and in an uninjured neonatal human heart (right panel). n = 1 heart was analyzed per condition. Scale bars, 3 mm in the overview and 250 μm in the zoom-ins. Dashed line in the left panel indicates the infarct border. c, qPCR results for Hmga1 on cDNA libraries from whole mouse hearts at different postnatal timepoints. GAPDH was used as a reference gene. Five biological replicates were used per timepoint. Datapoints represent individual biological replicates. Error bars indicate mean ± s.d. Statistics were performed using a one-way ANOVA followed by Dunnett’s multiple comparison test. One-way ANOVA analysis indicates a significant difference in Hmga1 expression between different timepoints (P = 0.0002). Dunnett’s multiple comparison test shows that P7 (P = 0.0022), P14 (P = 0.0049), P24 (P = 0.0003) and P56 (P = 0.002) significantly differ from the P1 timepoint, whereas P3 does not (P = 0.1727). d, Western blot for HMGA1 on protein lysate from 14-dpi ventricles (n = 3) and sham ventricles (n = 3) compared to a P3 ventricle (n = 1). TUBULIN was used as a control protein. Ratios were calculated using TUBULIN. Error bars indicate mean ± s.d. Statistics were performed using a one-way ANOVA followed by Tukey’s multiple comparisons test and show that both 14-dpi samples (P < 0.0001) and sham samples (P < 0.001) significantly differ from the P3 sample. Fourteen-dpi samples and sham samples do not significantly differ from each other (P = 0.021). |