
Fig. 1
- ID
- ZDB-FIG-250219-1
- Publication
- Bouwman et al., 2025 - Cross-species comparison reveals that Hmga1 reduces H3K27me3 levels to promote cardiomyocyte proliferation and cardiac regeneration
- Other Figures
- All Figure Page
- Back to All Figure Page
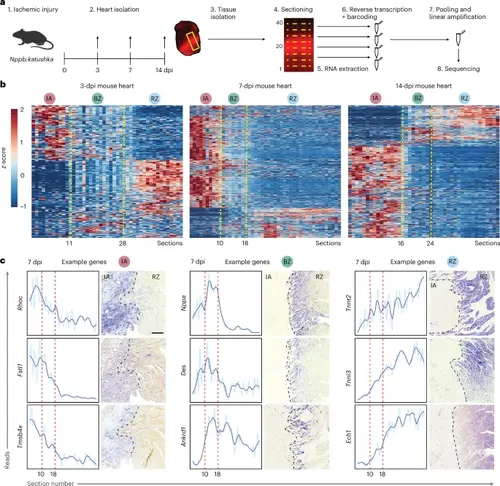
TOMO-seq reveals transcriptionally distinct regions in the injured mouse heart. a, Schematic overview of TOMO-seq workflow on injured mouse hearts. b, Three-dpi, 7-dpi and 14-dpi heatmaps showing hierarchical clustering for genes with a clear expression peak (z-score > 1 in more than four consecutive sections). Genes are on the y axis, and section numbers are on the x axis. Each section represents 100 μm of tissue. IA, BZ and RZ indicate consecutive sections with distinct gene profiles, separated by yellow dotted lines. c, Seven-dpi TOMO-seq plots with paired ISH images showing three representative genes for each zone. A total of n = 3 hearts were analyzed per staining. Red dashed lines in TOMO-seq plots indicate borders between IA, BZ and RZ, and black dashed lines in images indicate the border of the IA. Scale bar, 200 μm, which is the same for all ISH images. |