
Fig. 2
- ID
- ZDB-FIG-250219-2
- Publication
- Bouwman et al., 2025 - Cross-species comparison reveals that Hmga1 reduces H3K27me3 levels to promote cardiomyocyte proliferation and cardiac regeneration
- Other Figures
- All Figure Page
- Back to All Figure Page
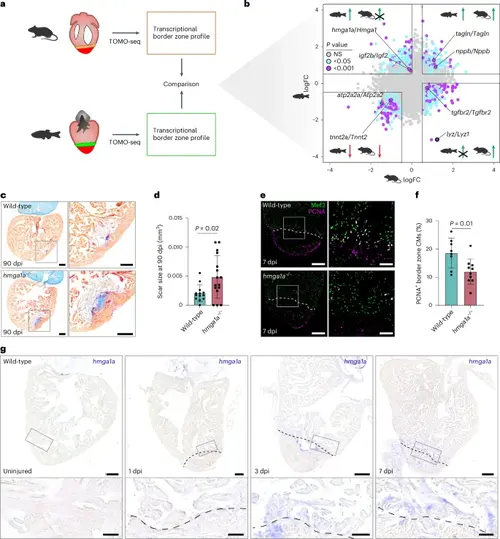
Interspecies comparison identifies Hmga1a, which spatially and temporally correlates with cardiac regenerative capacity. a, Schematic overview of the spatially resolved transcriptomic comparison of injured zebrafish and mouse BZs. b, Scatterplot analysis comparing BZ expression as logFC for homologous gene pairs. Gene pairs were selected based on the following criteria: only up in zebrafish (upper left quadrant); zebrafish logFC > 0.5, P < 0.05, and mouse logFC < 0; up in zebrafish and mouse (upper right quadrant); zebrafish logFC > 0.5, P < 0.05, and mouse logFC > 0.5, P < 0.05; down in zebrafish and mouse (lower left quadrant); zebrafish logFC < −0.5, P < 0.05, and mouse logFC < −0.5, P < 0.05; and only up in mouse (lower right quadrant); zebrafish logFC < 0 and mouse: logFC > 0.5, P < 0.05. Statistics were obtained using the R package edgeR, which uses GLMs and empirical Bayes methods to identify differentially expressed genes. NS, not significant. c, Representative images of AFOG staining on 90-dpi wild-type and hmga1a−/− zebrafish hearts, showing muscle in orange, fibrin in red and collagen in blue. Scale bars, 100 μm. d, Quantification of scar size in wild-type (n = 13) and hmga1a−/− (n = 16) hearts at 90 dpi. Datapoints represent individual hearts. Error bars indicate mean ± s.d. Statistics were performed by two-tailed unpaired t-test (P = 0.02). e, Representative images of immunofluorescent staining against Mef2 and PCNA on 7-dpi wild-type and hmga1a−/− zebrafish hearts. Dashed line indicates border with the injury. Overview scale bars, 100 μm; zoom-in scale bars, 20 μm. f, Quantification of proliferating BZ CMs in wild-type (n = 8) and hmga1a−/− (n = 10) hearts at 7 dpi. Datapoints represent individual hearts. Error bars indicate mean ± s.d. Statistics were performed by two-tailed unpaired t-test (P = 0.01). g, Representative images of ISH against hmga1a in uninjured, 1-dpi, 3-dpi and 7-dpi zebrafish hearts. n = 3 hearts were analyzed per condition. Scale bars, 100 μm in overviews and 25 μm in zoom-ins. Dashed line indicates border with the injury. |