
Fig. 4
- ID
- ZDB-FIG-240701-49
- Publication
- Doszyn et al., 2024 - Hyperactive mTORC1 disrupts habenula function and light preference in zebrafish model of Tuberous sclerosis complex
- Other Figures
- All Figure Page
- Back to All Figure Page
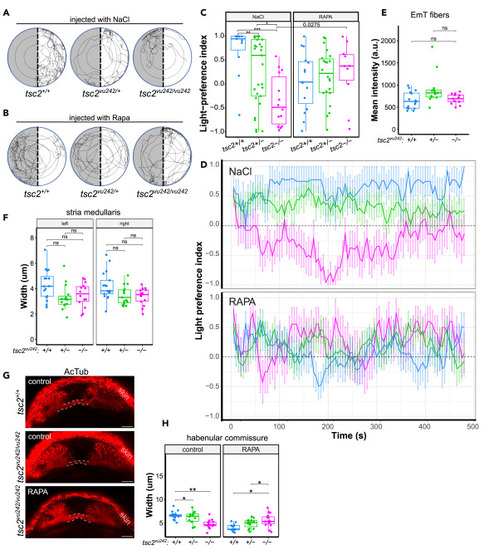
Rapamacin injections to the left habenula and afferent connectivity of LdHb in tsc2vu242 fish (A) Exemplary tracks of the tsc2vu242 fish injected to the left habenula with NaCl from the light-preference test. (B) Exemplary tracks of the tsc2vu242 fish injected to the left habenula with 1 μM rapamycin (Rapa) from the light-preference test. (C) Light-preference index of the tsc2vu242 fish after injections to the left habenula (tsc2vu242/vu242 vs. tsc2+/+: p = 0.00015 and vs. tsc2+/−: p = 0.006 for NaCl, p = ns for rapamycin (RAPA); tsc2vu242/vu242 fish injected with RAPA vs. NaCl: p = 0.0275). The dots on the boxplots represent the number of fish in the experiment (N > 10 per experimental group). (D) Analysis of light-preference index over time of the tsc2vu242 fish after injections to the left habenula (data presented as mean ± SD). (E) Mean intensity of calretinin fluorescence in the left habenulae of the tsc2vu242 fish. The dots on the boxplots represent the number of fish in the experiment (N > 10 per experimental group). (F) Width of SM in the tsc2vu242 fish brains. The dots on the boxplots represent the number of fish in the experiment (N > 10 per experimental group). (G) Representative horizontal optical sections through HC (outlined) of the tsc2vu242 fish (projection of 8 z-stacks). Scale bars, 20 μm. (H) HC width of the tsc2vu242 fish (tsc2vu242/vu242 vs. tsc2+/+: p = 0.002 for DMSO, p = 0.011 for RAPA). The dots on the boxplots represent the number of fish in the experiment (N > 10 per experimental group). |