
Fig. 3
- ID
- ZDB-FIG-240701-48
- Publication
- Doszyn et al., 2024 - Hyperactive mTORC1 disrupts habenula function and light preference in zebrafish model of Tuberous sclerosis complex
- Other Figures
- All Figure Page
- Back to All Figure Page
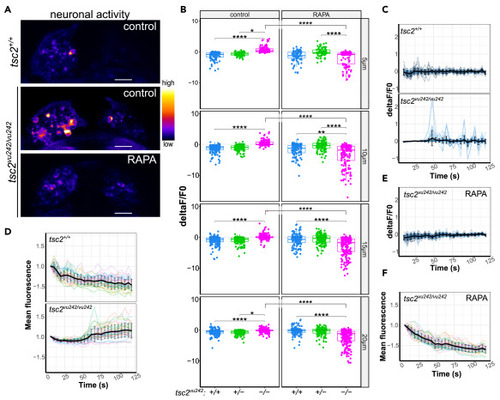
Neuronal activity in LdHb of tsc2vu242 fish (A) Representative images of neuronal activity in the habenulae of tsc2vu242 fish at 10 μm from the top. Scale bars, 20 μm. (B) Cumulative activity of the tsc2vu242 LdHb for all the layers of LdHb (5 μm: tsc2vu242/vu242 control vs. tsc2+/+ control p = 6.528 × 10⁻³³ and vs. tsc2vu242/vu242 treated with RAPA p = 5.958 × 10⁻³⁴; 10 μm: tsc2vu242/vu242 control vs. tsc2+/+ control p = 1.1232 × 10−44 and vs. tsc2vu242/vu242 treated with RAPA p = 1.625 × 10−47; 15 μm: tsc2vu242/vu242 control vs. tsc2+/+ control p = 5.928 × 10⁻³¹ and vs. tsc2vu242/vu242 treated with RAPA p = 4.68 × 10−52; 20 μm: tsc2vu242/vu242 control vs. tsc2+/+ control p = 1.104 × 10⁻¹⁴ and vs. tsc2vu242/vu242 treated with RAPA p = 5.958 × 10⁻³⁴). Dots on boxplots represent single cells. (C) Neuronal activity change over time in the tsc2vu242 LdHb at 10 μm from the top. (D) Normalized mean GCaMP5F fluorescence over time in the tsc2vu242 LdHb at 10 μm from the top. (E) Neuronal activity change over time in the tsc2vu242/vu242 mutant’s LdHb at 10 μm from the top after RAPA pretreatment. (F) Normalized mean GCaMP5F fluorescence over time in the tsc2vu242/vu242 mutant’s LdHb at 10 μm from the top after RAPA. (C-F) The mean with SD is shown in black. 7 fish per genotype per treatment were analyzed (N = 7 per experimental group). |