
Fig. 1
- ID
- ZDB-FIG-240701-46
- Publication
- Doszyn et al., 2024 - Hyperactive mTORC1 disrupts habenula function and light preference in zebrafish model of Tuberous sclerosis complex
- Other Figures
- All Figure Page
- Back to All Figure Page
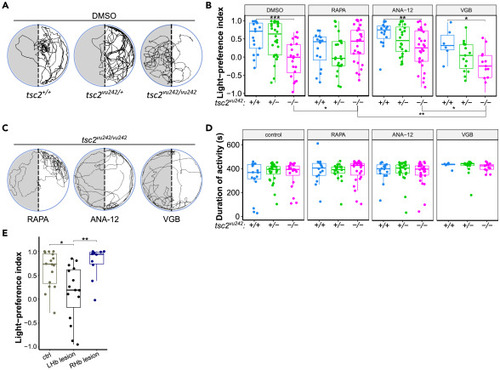
Light-preference test in tsc2vu242 fish (A) Exemplary tracks of tsc2vu242 fish from the light-preference test. (B) Light-preference index of tsc2vu242 fish after various treatments (tsc2vu242/vu242 vs. tsc2+/+: p = 0.0009 for DMSO, p = 0.588 for rapamycin (RAPA), p = 0.005 for ANA-12, p = 0.044 for vigabatrin (VGB); for tsc2vu242/vu242 treated with DMSO vs. RAPA p = 0.048). The dots on the boxplots represent the number of fish in the experiment (N > 10 per experimental group, except VGB tsc2+/+ where N = 6). (C) Exemplary tracks of tsc2vu242/vu242 mutant treated with RAPA, ANA-12, or VGB from the light-preference test. (D) Cumulative activity of tsc2vu242 fish during the light-preference test. The dots on the boxplots represent the number of fish in the experiment (N > 10 per experimental group, except VGB tsc2+/+ where N = 6). (E) Light-preference index of WT fish without lesions and with lesion of left (LHb) or right (Rhb) habenula (unlesioned vs. lesion of the left habenula: p = 0.019, lesion of the left habenula vs. lesion of the right habenula: p = 0.009). The dots on the boxplots represent the number of fish in the experiment (N > 10 per experimental group). |