
Fig. 2
- ID
- ZDB-FIG-240701-47
- Publication
- Doszyn et al., 2024 - Hyperactive mTORC1 disrupts habenula function and light preference in zebrafish model of Tuberous sclerosis complex
- Other Figures
- All Figure Page
- Back to All Figure Page
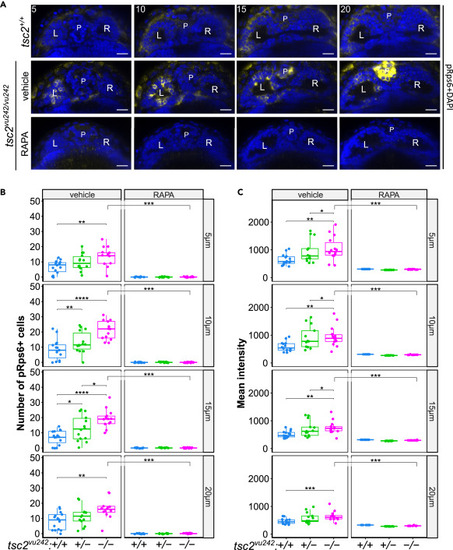
mTorC1 activation in tsc2vu242 fish habenulas (A) Representative optical sections through habenula of tsc2vu242/vu242 fish and their wild-type tsc2+/+ siblings at 5, 10, 15, and 20 μm from the top. pRps6—yellow, nuclei—blue. L—left habenula, R—right habenula, P—pineal complex. Scale bars, 20 μm. (B) Number of pRps6-positive cells in LdHb of tsc2vu242 fish (5 μm: tsc2vu242/vu242 control vs. tsc2+/+ control p = 0.004 and vs. tsc2vu242/vu242 treated with RAPA p = 1.038 × 10⁻⁵; 10 μm: tsc2vu242/vu242 control vs. tsc2+/+ control p = 4.656 × 10⁻⁵ and vs. tsc2vu242/vu242 treated with RAPA p = 1.038 × 10⁻⁵; 15 μm: tsc2vu242/vu242 control vs. tsc2+/+ control p = 1.584 × 10⁻⁵ and vs. tsc2vu242/vu242 treated with RAPA p = 1.038 × 10⁻⁵; 20 μm: tsc2vu242/vu242 control vs. tsc2+/+ control p = 0.004 and vs. tsc2vu242/vu242 treated with RAPA p = 1.038 × 10⁻⁵). The dots on the boxplots represent the number of fish in the experiment (N > 10 per experimental group). (C) Quantification of mean intensity of pRps6 fluorescence from LdHb of tsc2vu242 fish (5 μm: tsc2vu242/vu242 control vs. tsc2+/+ control p = 0.0051 and vs. tsc2vu242/vu242 treated with RAPA p = 1.0912 × 10⁻⁵; 10 μm: tsc2vu242/vu242 control vs. tsc2+/+ control p = 0.0017 and vs. tsc2vu242/vu242 treated with RAPA p = 1.0912 × 10⁻⁵; 15 μm: tsc2vu242/vu242 control vs. tsc2+/+ control p = 0.001 and vs. tsc2vu242/vu242 treated with RAPA p = 1.0912 × 10⁻⁵; 20 μm: tsc2vu242/vu242 control vs. tsc2+/+ control p = 0.0007 and vs. tsc2vu242/vu242 treated with RAPA p = 1.0912 × 10⁻⁵). The dots on the boxplots represent the number of fish in the experiment (N > 10 per experimental group). |