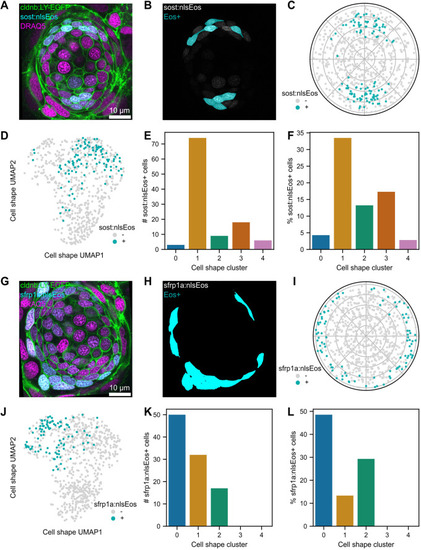
Location and shape characteristics of cells expressing sost:NLS-Eos and sfrp1a:NLS-Eos. (A) Single confocal slice of a neuromast from sost:NLS-Eos; Tg(-8.0cldnb:LY-EGFP) fish stained with DRAQ5. Image contrast was adjusted for visibility. (B) The same slice as in A, with the sost:NLS-Eos channel (gray) overlaid with a mask indicating cells classified as Eos+ (cyan). (C) Polar plot showing relative cell locations of locations of Eos+ (cyan) and Eos− (gray) cells. (D) UMAP of Eos+ (cyan) and Eos− (gray) cells from sost:NLS-Eos. (E) sost:NLS-Eos+ cells plotted as raw counts within each cell shape cluster. (F) sost:NLS-Eos+ cells plotted as the percentage of each cluster. (G) Single confocal slice of a neuromast from sfrp1a:NLS-Eos; Tg(-8.0cldnb:LY-EGFP) fish stained with DRAQ5. Image contrast was adjusted for visibility. (H) The same slice as in A, with the sfrp1a:NLS-Eos channel (gray) overlaid with a mask indicating cells classified as Eos+ (cyan). (I) Polar plot showing relative cell locations of locations of Eos+ (cyan) and Eos− (gray) cells. (J) UMAP of Eos+ (cyan) and Eos− (gray) cells from sfrp1a:NLS-Eos. (K) sfrp1a:NLS-Eos+ cells plotted as raw counts within each cell shape cluster. (L) sfrp1a:NLS-Eos+ cells plotted as the percentage of each cluster.
|
