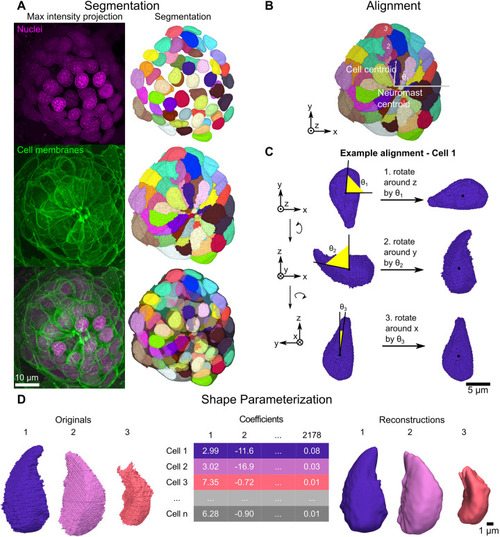
Overview of segmentation and shape parameterization. (A) Representative maximum intensity projections (left column) and corresponding 3D projections (right column) for nuclei labeled with DRAQ5 dye (top row), cells labeled by Tg(-8.0cldnb:LY-EGFP) (middle row) and both channels together (bottom row). (B) Image depicting how the first rotation angle is calculated. Example given for the maximum intensity projection segmentation channel of the neuromast shown in A. Cells 1, 2 and 3 are used in C and D. (C) Example of the alignment procedure as applied to cell 1 from B. To correct for radial symmetry, cells are first rotated around the z-axis. Cells were then rotated around the y-axis to correct for apicobasal tilt, and then around the x-axis to correct for off-parallel tilt during imaging. (D) Overview of shape parameterization using SH, as applied to cells 1, 2, and 3 from B. SH expansion is applied to original 3D surface meshes (left) to generate the cell-by-SHE coefficients table (middle), which can then be used to generate 3D reconstructions (right).
|
