|
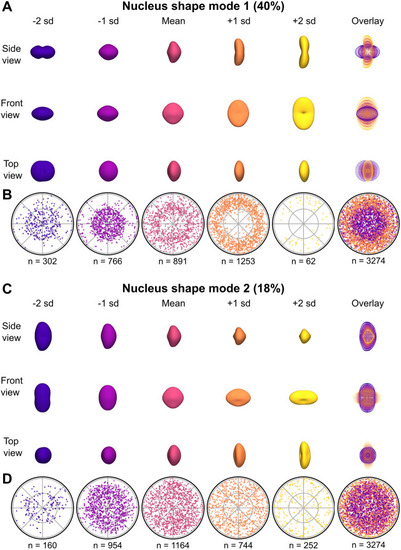
Visualization of nuclear shape modes 1 and 2. (A) Visualization of NSM1, generated as in Fig. 2A. 3D surface renderings are shown from three different views, as well as an overlay of point representations for each view (rightmost column). (B) Polar plots of relative cell locations (generated as in Fig. 2D) binned by NSM1 scores. An overlay of the first five plots is shown in the rightmost column. (C) Visualization of NSM2. 3D surface renderings are shown from three different views, as well as an overlay of point representations for each view (rightmost column). (D) Polar plots of relative cell locations binned by NSM2 scores. An overlay of the first five plots is shown in the rightmost column.
|