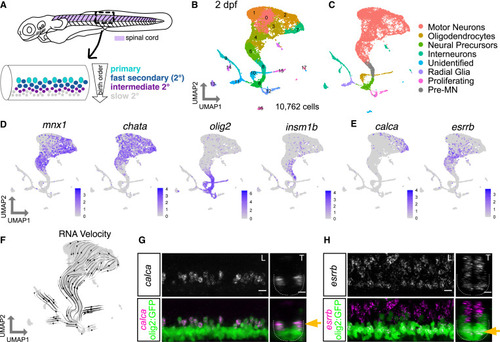
Zebrafish motor neuron functional subtypes are molecularly distinct (A) Diagram of 3 dpf zebrafish showing location of spinal cord in purple. Crop of the tail shows the spinal cord at a lateral view. MN functional subtypes indicated by colors are organized along the dorsoventral axis and by birth date. (B) Uniform manifold approximation and projection (UMAP) representation of 10,762 GFP+ cells at 2 dpf from 90 Tg(olig2:dsRed2) larvae. Each dot represents one cell; 18 cell clusters are represented by coloring. (C) Major cell classes indicated by colors represented in the UMAP as determined by marker genes. (D) Feature plots of marker genes for MN maturity. Purple indicates expression. (E) Feature plots for markers of mammalian fast (calca) and slow (esrrb) MNs. (F) RNA Velocity streamlines overlaid on UMAP coordinates in (B). (G) FISH of calca at 2 dpf. Left image (L) is lateral view, and right image (T) is transverse view of the spinal cord. Gold arrow indicates dorsoventral localization of gene expression within MN population. Dotted line indicates ventral spinal cord boundary. (H) FISH of esrrb at 2 dpf. Scale bars for (G) and (H), 10 μm.
|
