
- Title
-
Determinants of motor neuron functional subtypes important for locomotor speed
- Authors
- D'Elia, K.P., Hameedy, H., Goldblatt, D., Frazel, P., Kriese, M., Zhu, Y., Hamling, K.R., Kawakami, K., Liddelow, S.A., Schoppik, D., Dasen, J.S.
- Source
- Full text @ Cell Rep.
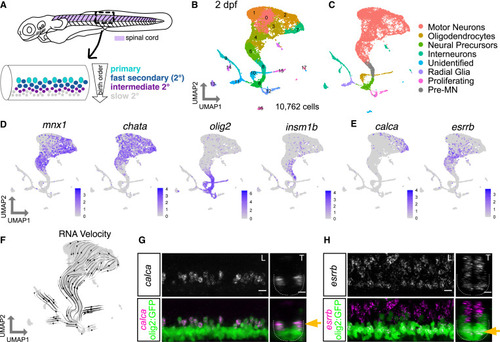
Zebrafish motor neuron functional subtypes are molecularly distinct (A) Diagram of 3 dpf zebrafish showing location of spinal cord in purple. Crop of the tail shows the spinal cord at a lateral view. MN functional subtypes indicated by colors are organized along the dorsoventral axis and by birth date. (B) Uniform manifold approximation and projection (UMAP) representation of 10,762 GFP+ cells at 2 dpf from 90 Tg(olig2:dsRed2) larvae. Each dot represents one cell; 18 cell clusters are represented by coloring. (C) Major cell classes indicated by colors represented in the UMAP as determined by marker genes. (D) Feature plots of marker genes for MN maturity. Purple indicates expression. (E) Feature plots for markers of mammalian fast (calca) and slow (esrrb) MNs. (F) RNA Velocity streamlines overlaid on UMAP coordinates in (B). (G) FISH of calca at 2 dpf. Left image (L) is lateral view, and right image (T) is transverse view of the spinal cord. Gold arrow indicates dorsoventral localization of gene expression within MN population. Dotted line indicates ventral spinal cord boundary. (H) FISH of esrrb at 2 dpf. Scale bars for (G) and (H), 10 μm. |
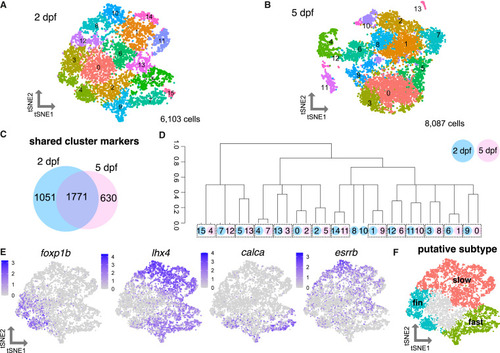
Heterogeneity of motor neuron functional subtypes is identifiable during development and at functional maturity (A) tSNE (t-distributed stochastic neighbor embedding) representing 6,103 MNs at 2 dpf. (B) tSNE representing 8,087 MNs at 5 dpf. (C) Venn diagram demonstrating overlap in cluster markers from 2 and 5 dpf MNs. (D) Dendrogram demonstrating relationships between 2 and 5 dpf MN clusters. Circle color indicates age (blue for 2 dpf, pink for 5 dpf). Circle number indicates cluster from (A) or (B). Dotted boxes group a 2 dpf cluster and its most closely related 5 dpf cluster. Expression of Hox genes may also contribute conserved molecular profiles between the 2 and 5 dpf datasets. (E) Feature plots showing fin (foxp1b), axial (lhx4), fast (calca), and slow (esrrb) MN marker expression within 2 dpf MN clusters as in (A). Purple indicates expression. (F) General map within tSNE space of putative MN subpopulations within 2 dpf MN clusters. |

Characterization of motor neuron functional subtype-restricted markers (A) Dot plot indicating expression of general fast and slow MN functional subtype markers. Light blue dot next to gene name indicates a transcription factor. At 2 dpf, uts2d is expressed by a small number of MNs. (B) Top: antibody stain demonstrating domain of Mnx (Hb9) expression within mature MNs in Tg(olig2::GFP) larvae at 2 dpf. Bottom: schematic indicating general domains of expression considered when verifying functional subtype expression. Dorsal GFP+ cells are putative fast MNs (blue), most ventral are progenitors or oligodendrocytes (green), and those between are putative slow MNs (gray). (C–J) FISH and feature plots for MN subpopulation markers at 2 dpf. Gold arrow indicates dorsoventral localization of FISH expression within MN population. Dotted line indicates ventral spinal cord boundary. Left image (L) is lateral view, and right image (T) is transverse view. Scale bars, 10 μm. |
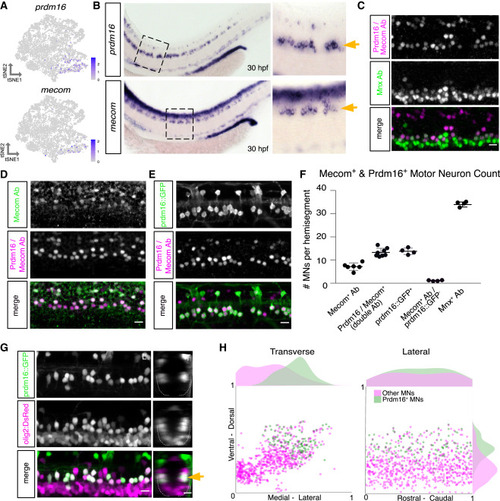
Prdm16 and Mecom mark dorsally positioned motor neurons (A) Feature plot of prdm16 and mecom expression in 2 dpf MN tSNE showing localization in fast MN clusters as in Figure 2F. (B) prdm16 and mecom in situ hybridization at 30 hpf in zebrafish. Zoomed image indicated by dashed box. Gold arrows indicate MNs. Additional staining in the dorsal spinal cord is labeling of some interneurons (prdm16) and a progenitor domain (mecom). (C) Antibody stain of Prdm16/Mecom within Mnx+ MNs in the zebrafish spinal cord at 2 dpf. Dorsal Prdm16/Mecom+; Mnx− cells are a subpopulation of interneurons. (D) Antibody stain showing overlap in expression between Prdm16/Mecom double antibody and Mecom alone antibody at 2 dpf. (E) Antibody stain showing overlap in expression between GFP+ cells in Tg(prdm16::GFP) line and Prdm16/Mecom double antibody at 2 dpf. (F) Quantification of Prdm16 and/or Mecom-expressing MNs from stains in (C)–(E). Line with bars indicates average with SEM. (G) Image of the spinal cord of a Tg(prdm16::GFP);Tg(olig2:dsRed2) larva at 5 dpf. Gold arrow indicates dorsoventral localization of GFP+ MNs within dsRed2+ population. Left image (L) is lateral view, and right image (T) is transverse view. (H) Soma position plot for GFP+ MNs and all other MNs quantified from five larvae at 5 dpf as in (G). Left plot shows the transverse view. Right plot shows the lateral view. Histograms on the top and sides of the plots indicate the distribution of cells across the axes. Green indicates GFP+;dsRed2+ cells. Magenta indicates GFP−;dsRed+ cells. Although magenta (other MNs) count could include olig2 progenitors or oligodendrocytes, these were largely excluded on the basis of morphology and localization. Scale bars, 10 μm. |

Prdm16 and Mecom define secondary fast motor neurons (A) Schematic of a transverse cross section of the zebrafish tail showing (left) the four dorsal-ventral muscle quadrants (black solid line with labels I, II, III, and IV) as defined by primary MN innervation pattern and the different muscle functional fiber types (solid light gray as slow, dashed dark gray outline as fast) and (right) the nerves that innervate them (slow muscle by septal nerves [light gray] and fast muscle by medial nerves [dark gray]). Primary MNs (p-type, light blue), responsible for escape behaviors, project along the medial nerve to innervate one of four fast muscle quadrants. m-type secondary MNs (dark blue) innervate fast muscle via the medial nerves. ms-type secondary MNs (purple) innervate both fast and slow muscle via the medial and septal nerves. s-type secondary MNs (light gray) innervate slow muscle via the septal nerves. Each individual secondary MN can innervate from one to four quadrants (I–IV) of muscle. (B) Transverse view of the zebrafish tail showing muscle innervation in Tg(prdm16::GFP);Tg(olig2:dsRed2) larvae at 5 dpf. Scale bar, 10 μm. (C) Average GFP fluorescence from Tg(prdm16::GFP) within each muscle quadrant normalized to the fourth quadrant within each fish at 5 dpf. Gray lines indicate individual fish. Black points indicates average with SEM. (D) Pie chart showing subtype proportions labeled in pan-MN sparse label experiment.31 Inner subtype distribution numbers detailed in Table S1. (E) Pie chart showing subtype proportions labeled in Tg(prdm16:GAL4). (F) Example images of all sparsely labeled subtypes in (E). Number in parentheses indicates number of times subtype was labeled. |

prdm16 and mecom are required for normal muscle innervation (A) Transverse view of the zebrafish tail showing Prdm16+ MN muscle innervation in Tg(prdm16::GFP) control, mecom mutant, and prdm16 mutant larvae at 5 dpf. Scale bars, 10 μm. (B) Average GFP fluorescence of each muscle quadrant normalized to the fourth quadrant for control Tg(prdm16::GFP) fish (n = 6), mecom mutant (n = 9), and prdm16 mutant (n = 10) larvae at 5 dpf. Error bars indicate SEM. Lines illustrate linear regression for each condition and gray area surrounding control indicates SD of the slope, ±0.00555. (C) Percentage of cells from control, mecom mutant, and prdm16 mutant Tg(prdm16:GAL4) sparse label experiments in (D)–(F) that innervated each dorsoventral muscle quadrant. Asterisk indicates significant difference (prdm16 −/− domain I, p = 0.000891; mecom −/− domain I, p = 0.004121), all other domains were not significantly different (p > 0.00625). (D) Pie chart showing subtype proportions labeled in Tg(prdm16:GAL4) sparse label for control larvae. Replicated from Figure 5E. (E) Pie chart showing subtype proportions labeled in Tg(prdm16:GAL4) sparse label for mecom mutant larvae. (F) Pie chart showing subtype proportions labeled in Tg(prdm16:GAL4) sparse label for prdm16 mutant larvae. (G) Example images of all sparsely labeled subtypes unique to mutants (E and F). Number in parentheses indicates number of times subtype was labeled. (H) Example of an unclassifiable cell found in mutant sparse label experiment from the lateral view (right) compared with a control cell (left). Dashed coral lines indicate myotome boundaries. Coral arrows indicate motor exit points. Controls can indicate either WT or prdm16 +/− or mecom +/− animals, which are phenotypically indistinguishable. |

Erosion of fast motor neuron transcriptional profiles in prdm16 mutants (A) tSNE representing all MNs from WT (8,145), mecom mutant (4,210), and prdm16 mutant (6,493) larvae at 5 dpf. Cluster 14 was determined to be fast MNs (WT, n = 88; mecom mutant, n = 40; and prdm16 mutant, n = 65). (B) Violin plots representing log fold expression of fast MN markers (pcp4a, calca, calb2b, scn4ba, nefma) and slow MN marker (uts2d) in cluster 14 of (A) identified as normally Prdm16+ fast MNs. uts2d showed a 3 log fold change increase in prdm16 mutants (adjusted p = 0.0194). (C) FISH of uts2d in Tg(prdm16::GFP) control and prdm16 mutant larvae at 5 dpf. Scale bars, 10 μm. (D) Left: quantification of uts2d+ cells and GFP+uts2d+ cells in Tg(prdm16::GFP) larvae at 5 dpf as in (C). Right: percentage of total GFP+ cells that express uts2d. Line indicates average with SEM. Unpaired t tests. (E) FISH of satb2 in Tg(prdm16::GFP) control and prdm16 mutant larvae at 5 dpf. Scale bars, 10 μm. (F) Left: quantification of satb2+ cells and GFP+; satb2+ cells in Tg(prdm16::GFP) larvae at 5 dpf as in (E). Right: percentage of total GFP+ cells that express satb2. Line indicates average with SEM. Unpaired t tests. |