FIGURE

Figure S9.

ID
ZDB-FIG-240111-37
Publication
Heins-Marroquin et al., 2024 - CLN3 deficiency leads to neurological and metabolic perturbations during early development
Other Figures
All Figure Page
Back to All Figure Page
Figure S9.

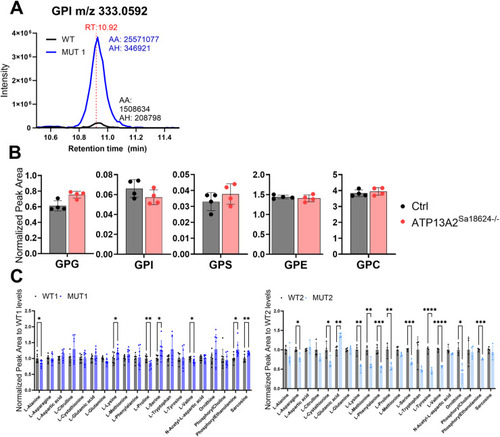
Analysis of GPDs and amino acids in polar extracts of WT, MUT1, and atp13a2sa18624−/− zebrafish larvae using targeted LC-MS analysis.

(A) Representative LC-MS extracted ion chromatograms of GPI (m/z 333,0592; RT 10.92 min) obtained with polar metabolite extracts from WT and MUT1 zebrafish larvae (5 dpf) showing the highest peak at RT 10.92 min. (B) GPD analysis in polar metabolite extracts of WT and atp13a2Sa18624−/− larvae (6 dpf). Each dot represents a pool of 10 larvae, and in total, four biological replicates were measured. (C) Amino acids that were not significantly altered in whole-larva extracts of WT and MUT, based on targeted analysis. Metabolite levels of amino acids differing significantly between WT and MUT1 zebrafish larvae at 5 dpf based on targeted LC-MS measurements. Data shown are means ± SDs of eight biological replicates for WT1/MUT1 (n = 200 larvae per genotype) and four biological replicates for WT2/MUT2 (n = 40 larvae per genotype). AA, automatic (integration) area; AH, automatic height.

Expression Data

Expression Detail
Antibody Labeling
Phenotype Data

Phenotype Detail
Acknowledgments
This image is the copyrighted work of the attributed author or publisher, and ZFIN has permission only to display this image to its users. Additional permissions should be obtained from the applicable author or publisher of the image. Full text @ Life Sci Alliance