|
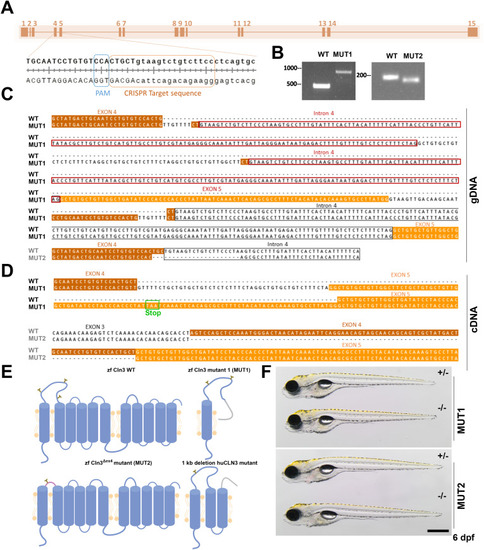
Generation of two stable cln3 mutant lines in zebrafish using CRISPR/Cas9. (A) Schematic map of the cln3 gene with zoom on the gRNA target site. Uppercase letters represent the end of exon 4, and lowercase letters, the beginning of intron 4. (B) Gel electrophoresis of PCR amplicons from the mutated region in gDNA of F2 founders. (C) gDNA sequences of the two stable cln3 mutant lines generated by the CRISPR/Cas9 technology. (D) Based on cDNA sequence analysis from the pGEMT cloning, MUT1 carries an indel mutation resulting in a truncated translation product of 122 amino acids and MUT2 displays an in-frame deletion of exon 4. WT exon 4 sequence is highlighted in brown, exon 5 in orange, and intron 4 with a black box. Additional copies of intron 4 are highlighted with red boxes and the premature stop codon with a green box. (E) Schematic representation, based on the in silico prediction of transmembrane helices and N-glycosylation sites, of the expected protein products encoded by the WT, MUT1, and MUT2 alleles, as well as the main transcript of the most common human Batten disease CLN3 allele (1-kb deletion; huCLN3). (F) MUT1 and MUT2 mutants and heterozygous controls at 5 dpf. The scale bar represents 500 μm. Homozygous mutants are morphologically indistinguishable from their heterozygous counterparts. WT, wild type; zf, zebrafish; hu, human.
|