FIGURE

Figure S5.

ID
ZDB-FIG-240111-31
Publication
Heins-Marroquin et al., 2024 - CLN3 deficiency leads to neurological and metabolic perturbations during early development
Other Figures
All Figure Page
Back to All Figure Page
Figure S5.

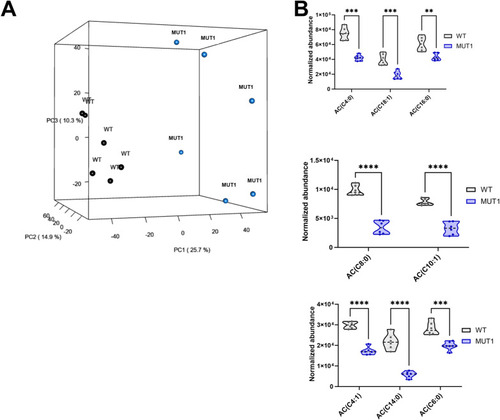
Untargeted metabolomics analysis using LC-MS (experiment 1).

(A) Principal component analysis for WT (black) and MUT1 (blue) zebrafish larvae based on all variables (m/z features) detected in positive and negative modes. The first principal component (PC1) explains 25.7% of the variation, the second component 14.9%, and the third component 10.3%. (B) Violin plots showing normalized abundance values for the indicated acylcarnitines in WT and MUT1 samples. Statistically significant differences between lines were determined using an unpaired multiple Welch’s t test (*P ≤ 0.05; **P ≤ 0.01; ***P ≤ 0.001; and ****P < 0.0001).

Expression Data

Expression Detail
Antibody Labeling
Phenotype Data

Phenotype Detail
Acknowledgments
This image is the copyrighted work of the attributed author or publisher, and ZFIN has permission only to display this image to its users. Additional permissions should be obtained from the applicable author or publisher of the image. Full text @ Life Sci Alliance