|
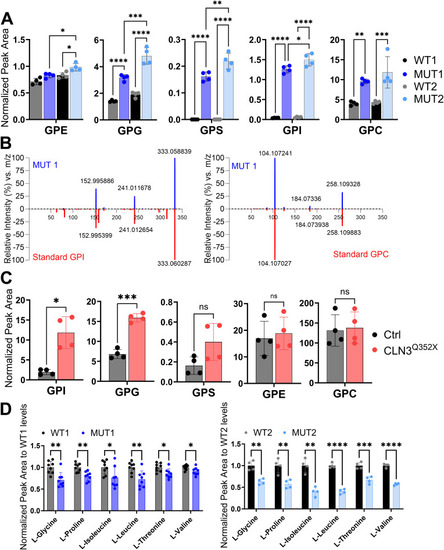
Validation of glycerophosphodiester and amino acid changes by targeted LC-MS analyses. (A) Metabolite levels of glycerophosphodiester species (GPE, GPI, GPS, GPG, and GPC) extracted from batches of 10 whole zebrafish larvae at 5 dpf (n = 40 larvae for each genotype). (B) Representative MS/MS spectrum plots of GPI and GPC from MUT1 extracts (in blue) and metabolite standards (in red), further confirming compound identities (matching library score 83%, isotopic pattern score 100%). (A, C) Metabolite levels of the same glycerophosphodiester species as shown in panel (A), but extracted from human iPSC-derived cerebral organoids after 55 d of differentiation (n = 4). (D) Metabolite levels of amino acids differing significantly between WT and MUT1 zebrafish larvae at 5 dpf based on targeted LC-MS measurements. Data shown are means ± SDs of eight biological replicates for WT1/MUT1 (n = 200 larvae per genotype) and four biological replicates for WT2/MUT2 (n = 40 larvae per genotype). Statistically significant differences between WT and mutant zebrafish samples were determined using multiple comparison one-way ANOVA followed by Tukey’s correction, and for iPSC samples, an unpaired t test was used (*P ≤ 0.05; **P ≤ 0.01; ***P ≤ 0.001; and ns, not significant).
|