FIGURE

Fig 8

ID
ZDB-FIG-231215-207
Publication
Maung Ye et al., 2023 - A cell-and-plasma numerical model reveals hemodynamic stress and flow adaptation in zebrafish microvessels after morphological alteration
Other Figures
All Figure Page
Back to All Figure Page
Fig 8

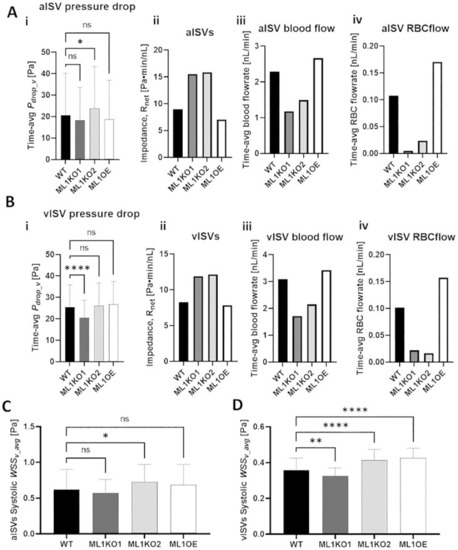
Comparison of pressure and WSS distributions in ISVs amongst WT and Marcksl1 network models.

(A) Group-average (5 aISVs) of the time-averaged pressure drop (Pdrop_v) in aISVs amongst models (i) and the corresponding impedance (Rnet) (ii), blood flow rate (iii) and RBC flow rate (iv) in the aISVs. (B) Group-average (5 vISVs) of the time-averaged pressure drop (Pdrop_v) in vISVs amongst models (i) and the corresponding Rnet (ii), blood flow rate (iii) and RBC flow rate (iv) in the vISVs. (C) Group-averaged (5 aISVs) systolic peak WSS (WSSv_avg) in aISVs amongst models. (D) Group-averaged WSSv_avg in vISVs amongst models. Statistical comparisons were performed using one-way ANOVA with Sidak’s multiple pair comparisons. *, p < 0.05; **, p < 0.01; ****, p < 0.0001.

Expression Data

Expression Detail
Antibody Labeling
Phenotype Data

Phenotype Detail
Acknowledgments
This image is the copyrighted work of the attributed author or publisher, and ZFIN has permission only to display this image to its users. Additional permissions should be obtained from the applicable author or publisher of the image. Full text @ PLoS Comput. Biol.