IMAGE

Fig 8

ID
ZDB-IMAGE-231215-228
Source
Figures for Maung Ye et al., 2023
Image
Figure Caption

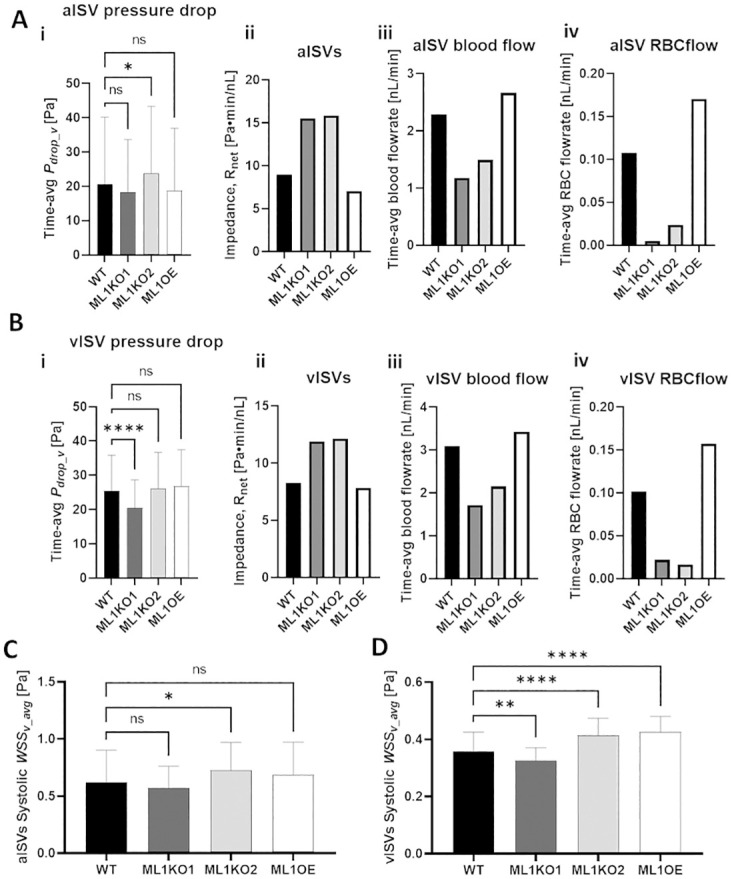
Fig 8 Comparison of pressure and WSS distributions in ISVs amongst WT and Marcksl1 network models.

(A) Group-average (5 aISVs) of the time-averaged pressure drop (Pdrop_v) in aISVs amongst models (i) and the corresponding impedance (Rnet) (ii), blood flow rate (iii) and RBC flow rate (iv) in the aISVs. (B) Group-average (5 vISVs) of the time-averaged pressure drop (Pdrop_v) in vISVs amongst models (i) and the corresponding Rnet (ii), blood flow rate (iii) and RBC flow rate (iv) in the vISVs. (C) Group-averaged (5 aISVs) systolic peak WSS (WSSv_avg) in aISVs amongst models. (D) Group-averaged WSSv_avg in vISVs amongst models. Statistical comparisons were performed using one-way ANOVA with Sidak’s multiple pair comparisons. *, p < 0.05; **, p < 0.01; ****, p < 0.0001.

Acknowledgments
This image is the copyrighted work of the attributed author or publisher, and ZFIN has permission only to display this image to its users. Additional permissions should be obtained from the applicable author or publisher of the image. Full text @ PLoS Comput. Biol.